AI Value Investing Portfolio Holds 35% Returns in Investment Report Amid Semiconductor Strength


Semiconductor Surge Amid Flat-to-Higher Markets… 'AI Value Investing Portfolio' Keeps Returns in the 35% Range
As the KOSPI surged 2.24% to well above the 5,850 mark, the Nasdaq and the Philadelphia Semiconductor Index also continued their upward march. With capital flowing back into AI semiconductors at the center of the market, the AI Value Investing Portfolio — which has kept Nvidia and Micron at its core and adjusted positions based on valuation — posted a +35.44% return on initial capital, defending total assets of $13,544.
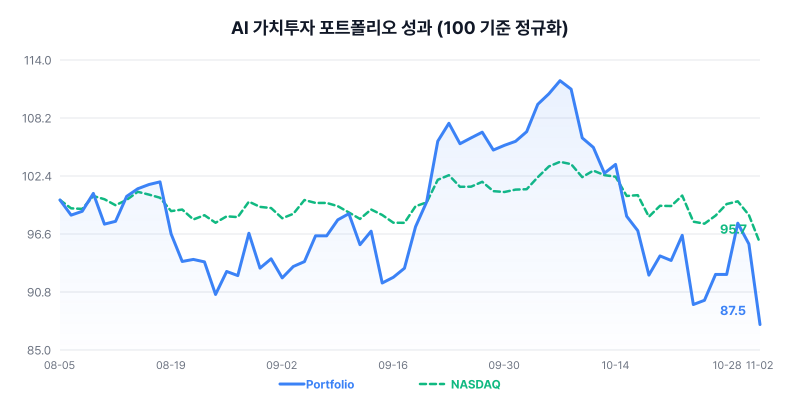
An Unshaken Return Curve Between Surges and Corrections
Looking at the asset trajectory over the past five days, the portfolio soared past the $15,100 level in late October before settling back to $13,544 on the first trading day of November. The sharp pullbacks in Micron and AMD were the main drivers — and because cumulative gains in late October were large, the retracement was equally steep. Still, the portfolio manager secured cash at each sharp dip and continued dollar-cost averaging into undervalued assets; with cash now fully deployed, the portfolio is responding to the correction phase by reassessing the intrinsic value of its current holdings.
Holdings Check: The Weight of Undervalued Semiconductors
The portfolio's strength is concentrated in AI semiconductors. Nvidia, whose PEG ratio — a measure of share price relative to growth — stands at just 0.25, still retains the appeal of a value stock. Micron's share price is slightly below its purchase cost, but its price-to-earnings ratio (PER) based on EPS of $74.33 is only 11.9x, suggesting the benefits of the memory supercycle have not yet been fully priced in.
| Stock | Quantity | Purchase Price | Current Price | PER |
|---|---|---|---|---|
| Nvidia | 24.00 shares | $184.21 | $204.64 | 25.9 |
| Broadcom | 5.67 shares | $326.03 | $326.08 | 41.6 |
| Micron | 1.30 shares | $930.96 | $884.74 | 11.9 |
| AMD | 6.47 shares | $198.62 | $504.80 | 128.8 |
| TSMC | 0.44 shares | $431.81 | $406.13 | 26.3 |
| Amazon | 1.95 shares | $208.39 | $240.35 | 19.4 |
| Meta | 0.55 shares | $653.56 | $614.99 | 21.0 |
| Intel | 2.80 shares | $104.56 | $65.76 | - |
| SOXL | 13.92 shares | $71.22 | $77.05 | - |
| TQQQ | 1.13 shares | $76.34 | $62.01 | - |
AMD has delivered returns of more than 150% over purchase cost, but with a PER above 128x, market expectations are already priced in. A PEG of 0.50 still signals room relative to growth, yet the manager has repeatedly trimmed the position to lock in some profits. Intel remains unprofitable with negative EPS and is sitting on a 37% loss versus invested capital; its upcoming earnings will be the key test of whether it can emerge as the winner of the semiconductor industry's restructuring.
Trade Review: A Cycle of Position Management and Buying Undervalued Names
| Date | Type | Stock | Quantity | Price |
|---|---|---|---|---|
| 2026-10-30 | Buy | TSMC | 0.44 shares | $431.81 |
| 2026-10-30 | Sell | AMD | 0.34 shares | $566.42 |
| 2026-10-23 | Buy | Micron | 0.47 shares | $856.49 |
| 2026-10-23 | Sell | Nvidia | 1.26 shares | $212.21 |
| 2026-10-23 | Sell | AMD | 0.36 shares | $507.93 |
| 2026-10-16 | Buy | Micron | 0.31 shares | $931.24 |
| 2026-10-16 | Sell | Nvidia | 1.33 shares | $217.23 |
| 2026-10-09 | Buy | Micron | 0.11 shares | $1035.84 |
| 2026-10-09 | Sell | TQQQ | 0.06 shares | $80.23 |
| 2026-10-09 | Sell | SOXL | 0.73 shares | $142.52 |
The recent trading pattern is a repeated cycle of 'profit-taking and reallocation.' Each time AMD surged above its purchase cost, the manager sold part of the position and shifted funds into Micron and TSMC, which were relatively more undervalued within the sector. When Nvidia grew to account for more than a third of total assets, raising concentration risk, the manager trimmed part of the stake while maintaining the core AI exposure. The weights of the 3x leveraged products SOXL and TQQQ were also reduced during the correction phase as part of volatility management. The consistent principle: buy when indicators point to undervalued levels, and sell when market expectations run hot.
Market Outlook: Fading Volatility and Falling Oil Prices Bring a Double Effect
Market indicators show the fear gauge (VIX) falling more than 7% to 18.04, signaling a revival of risk appetite, while the U.S. 10-year Treasury yield edged lower, easing valuation pressure on growth stocks. The sharp declines in Brent crude (-9.89%) and WTI (-6.38%) could act as a tailwind by easing inflation pressure, though they could also be read as a warning of slowing demand — requiring a multi-faceted assessment. The semiconductor sector's correction is closer to a reset of expectations than a breakdown of its structural growth narrative. Still, performance gaps may widen between names with burdensome valuations like AMD and those undervalued relative to growth like Micron, making a selective approach increasingly important going forward.
※ This report analyzes the simulated operation of the AI Value Investing Portfolio and is not investment advice. Actual investments should be made at your own discretion and responsibility.
Want the full portfolio details?
Subscribe to the newsletter below to receive detailed daily investment reports.