Investment Report: A Solid 50% Return Trend Recorded Amidst Market Panic


[Daily Market Insight] The Message Sent by a 50% Return in an AI Value Portfolio Amidst 'Panic Selling'
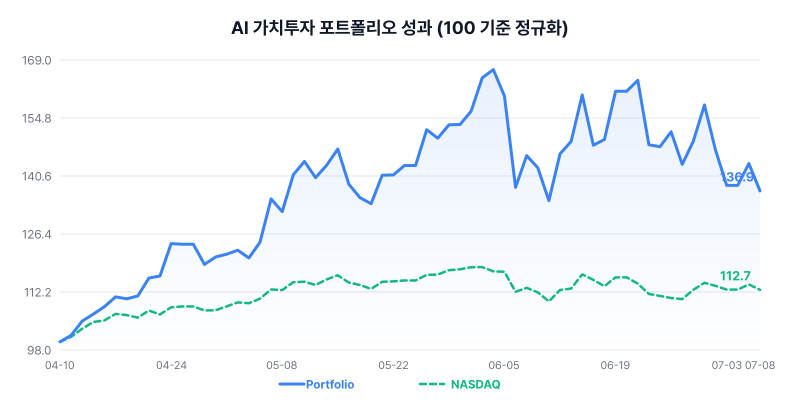
On July 8, 2026, the Seoul financial market was awash in red. The KOSPI plunged over 5% and the KOSDAQ collapsed nearly 6%, leaving investors gripped by fear. While the Nasdaq managed to barely hold its defense line thanks to semiconductor strength, the won’s value plummeted, sending the dollar/won exchange rate falling below the 1,500 won mark. Despite this market downturn, the AI Value Investment Portfolio flashed green. The portfolio's total assets for the day were tallied at just over $15,000, with a cumulative return reaching a remarkable 50.58%. It was a day that confirmed a solid earnings structure unshaken by external shocks.
The Paradox of a Crash: A 50% Return
This portfolio has shown a distinct trend of earnings recovery over the past few days. After total assets peaked at $16,154 on July 2, it went through a temporary adjustment before firmly holding the $15,000 line again. Even as the market's Volatility Index (VIX) fluctuated above 16 amidst a sense of crisis, this portfolio's asset curve has been moving sideways rather than falling, maintaining a defensive posture. This is not merely luck; it is the power of valuation selection backed by high growth potential.
The Delicate Balance of PER and PEG: Diagnosis of Holdings
The core of the profit comes from the balance between valuation and growth. The valuation metrics of current holdings tell an intriguing story. Broadcom (AVGO) is currently trading at $370.78, and despite a high PER of 61.7, it shows a very low PEG ratio of 0.42, suggesting sufficient room for further stock price appreciation. Micron (MU) is also in a state of overwhelming undervaluation, with earnings per share (EPS) nearing a whopping $42, a PER of 22.3, and a PEG ratio of 0.15.
Semiconductor dominators Nvidia (NVDA) and AMD are no exception. Nvidia's PER remains in the early 30s with a PEG of 0.6, proving stable growth, while AMD reflects its EPS growth trend despite a high PER. While leveraged products like SOXL play a role in increasing volatility within the portfolio, mega-cap tech stocks like Amazon (AMZN) and Meta (META) serve as stable collateral at a PEG of around 1. Ultimately, this portfolio operates on the logic that these are high-priced stocks that remain cheap when viewed through the lens of growth (PEG).
| Ticker | Qty | Avg Buy Price | Current Price | PER |
|---|---|---|---|---|
| Nvidia (NVDA) | 25.76 | $183.15 | $196.93 | 30.1 |
| AMD | 7.17 | $198.62 | $516.11 | 172.6 |
| Micron (MU) | 0.25 | $996.00 | $938.38 | 22.3 |
| Broadcom (AVGO) | 5.67 | $326.03 | $370.78 | 61.7 |
| Meta (META) | 0.93 | $653.56 | $615.58 | 21.8 |
| Amazon (AMZN) | 1.95 | $208.39 | $245.98 | 31.7 |
| SOXL | 17.15 | $61.36 | $165.28 | 28.1 |
The Art of Concentration and Diversification: Review of Recent Trades
The trading flow since June reveals the dynamism of this strategy. It aggressively bought Micron (MU), making a play for undervalued stocks based on low PEG ratios. Conversely, for highly volatile stocks like SOXL, it repeatedly 'realized profits' and 'rebalanced' at every short-term surge. In particular, it demonstrated wisdom by selling SOXL on June 19 and April 24 to lock in gains while reducing overall portfolio risk.
The consistent approach to Nvidia (NVDA) is also noteworthy. Nvidia was bought three times between April and June, increasing its weight on the back of surging AI chip demand and low PEG ratios. Recently, selling small amounts of Amazon and Meta to balance the portfolio also demonstrates meticulous control to minimize portfolio fluctuation.
| Date | Type | Ticker | Qty | Price |
|---|---|---|---|---|
| 2026-07-03 | Sell | Amazon (AMZN) | 0.10 | $242.67 |
| 2026-07-03 | Sell | Meta (META) | 0.05 | $582.90 |
| 2026-06-26 | Buy | Nvidia (NVDA) | 1.29 | $195.74 |
| 2026-06-19 | Sell | SOXL | 0.90 | $279.29 |
| 2026-06-05 | Buy | Micron (MU) | 0.25 | $996.00 |
| 2026-06-05 | Sell | SOXL | 0.95 | $262.70 |
Market Outlook: Watching the Aftermath of a Surge
The macro environment is showing signs of change, with U.S. 10-year Treasury yields rising to 4.579% and gold futures undergoing correction. While the Dow Jones index fell, the semiconductor index rose over 2%, highlighting 'divergent movements' within the market. This portfolio is essentially betting on tech growth stocks centered around semiconductors, and current valuation metrics support the notion that this trend will remain valid for the time being. However, for certain stocks that have surged sharply, a conservative approach—boldly realizing profits to protect the principal, as seen in recent trades—is now necessary.
※ This report analyzes the simulated operation history of the AI Value Investment Portfolio and does not constitute investment advice. Actual investment should be undertaken at your own judgment and responsibility.
Want to know the details of the portfolio?
Subscribe to the newsletter below to receive detailed investment reports daily.