Amazon Tops US Listed Companies in Revenue; Alphabet Leads in Profit Margin

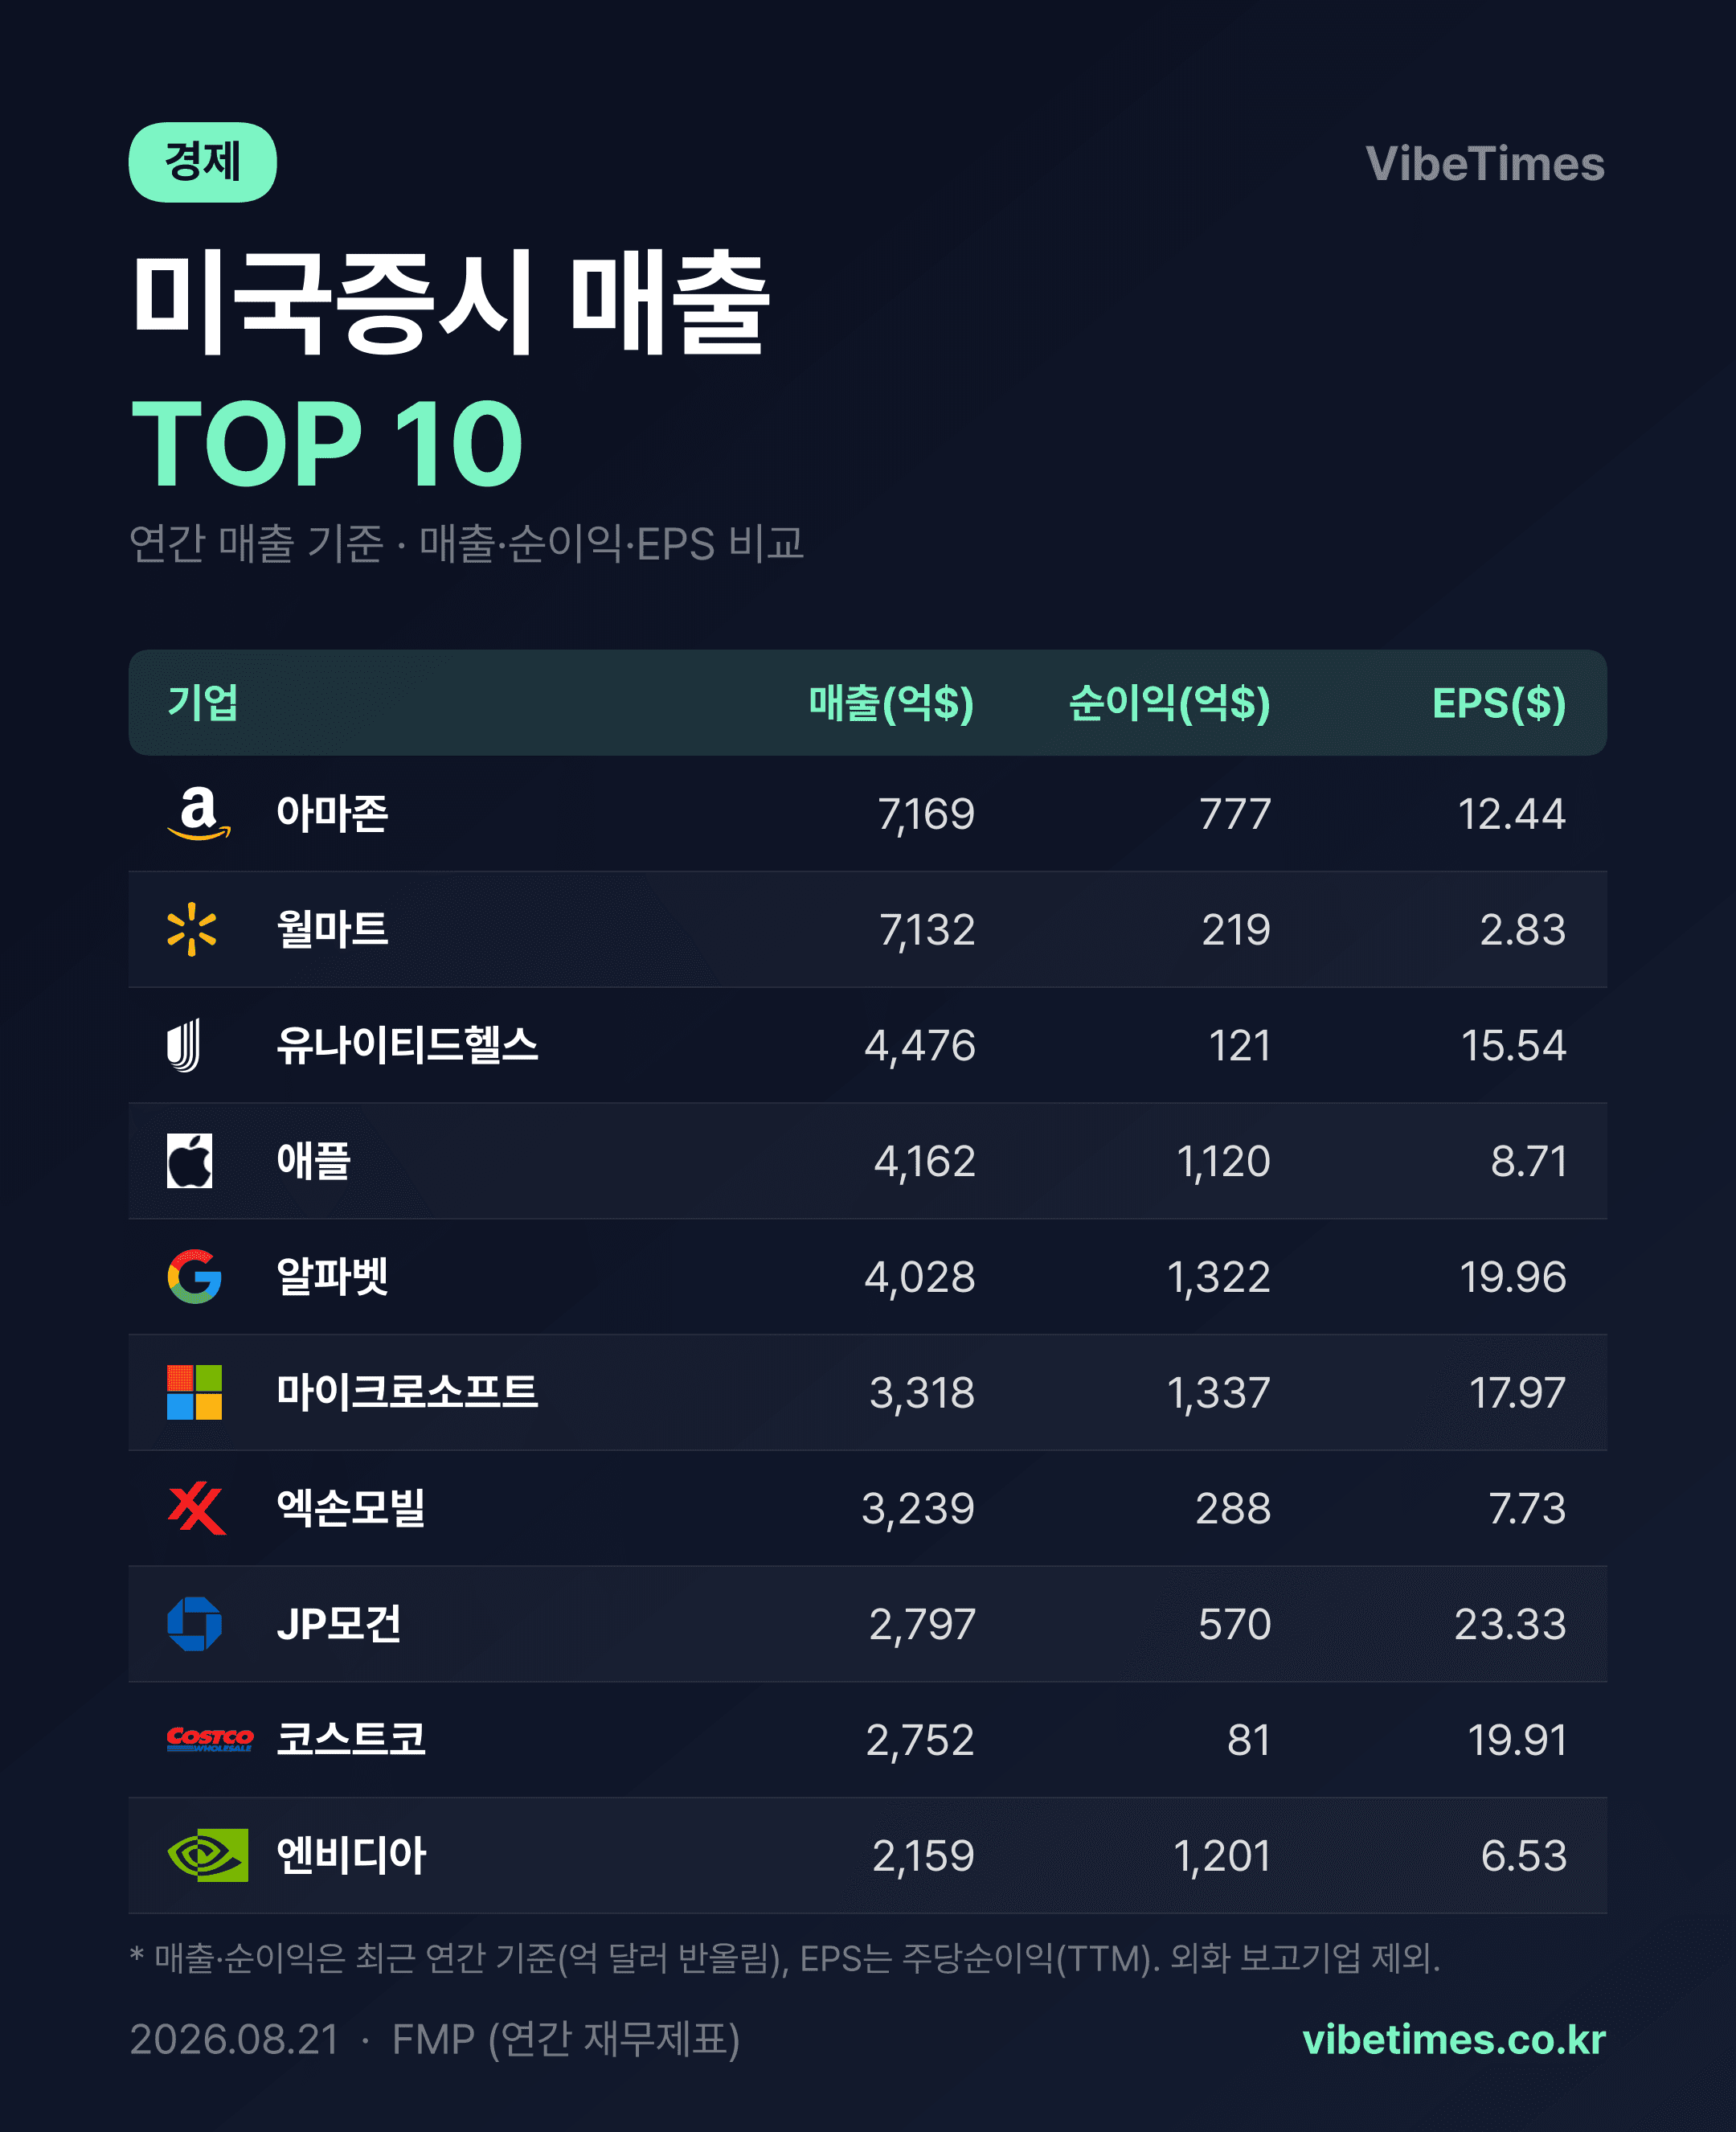
As of August 21, 2026, Amazon topped the list of the top 10 US listed companies by revenue with $716.9 billion in annual sales. The gap with second-place Walmart was a mere $3.7 billion. In contrast, Alphabet recorded the highest profit efficiency among the top 10, with a net profit margin of 32.8%.
Amazon and Walmart Battle for the $700 Billion Revenue Track
Amazon’s $716.9 billion in revenue puts it virtually on par with Walmart’s $713.2 billion. Given that both companies’ revenue scales are more than 60% larger than that of third-ranked UnitedHealth ($447.6 billion), analysts interpret this as indicating that the scale competition in the distribution and e-commerce sectors is on a completely different level from other industries.
However, their profit structures are diametrically opposed. Amazon’s net profit was $77.7 billion, more than 3.5 times that of Walmart ($21.9 billion). In terms of net profit margin, the gap widens to 10.8% for Amazon versus 3.1% for Walmart. While Walmart demonstrates the limitations of traditional low-margin retail, Amazon’s performance is attributed to the increased weighting of high-margin businesses such as cloud services and advertising.
Alphabet Ranks First in Net Profit Margin, Demonstrating the Power of Platforms
Alphabet, which ranked fifth in revenue, posted a net profit of $132.2 billion, placing it at the very top in terms of profit scale within the top 10. Its net profit margin reached 32.8% against revenue of $402.8 billion. This result directly reflects their business model, which generates quick cash returns through search and YouTube advertising.
Microsoft follows a similar pattern. While ranked sixth with $331.8 billion in revenue, its net profit of $133.7 billion actually exceeds Alphabet’s, with a net profit margin calculated at 40.3%—the highest figure in the top 10. Meanwhile, Apple maintained a market cap of $4.62 trillion despite ranking fourth in revenue at $416.2 billion, reaffirming that it is evaluated as an ecosystem service company rather than a hardware manufacturer.
Market Capitalization Rankings Tell a Different Story
The divergence between revenue rankings and market capitalization is stark. Nvidia, ranked 10th in revenue, boasts a market cap of $5.27 trillion, the highest among listed companies. Although its revenue of $215.9 billion is only one-third of Amazon's, its net profit of $120.1 billion is nearly 1.5 times that of Amazon. This translates to a net profit margin of 55.6%. It serves as a prime example of how the market evaluates the dominant position of AI semiconductors.
Conversely, UnitedHealth ranks third in revenue with $447.6 billion, yet its market cap remains at $348.8 billion. Its net profit margin of 2.7% is the lowest among the top 10. This clearly reflects the industry characteristic where, despite high revenue from collecting insurance premiums, profits are slim due to payouts to hospitals. Similarly, ExxonMobil’s financials reflect the nature of the crude oil refining and sales business, with an 8.9% net profit margin against revenue of $323.9 billion.
Investment Implications and Outlook
The key takeaway from this data is that revenue scale does not necessarily correlate with shareholder value. The top market cap companies—Nvidia, Apple, Microsoft, and Alphabet—all share high-profit structures with net profits exceeding $110 billion. This suggests investors are rewarding profit generation per unit of revenue over sales growth.
This dynamic is unlikely to change easily in the near future. AI-related demand is expected to further increase the profit leverage for Nvidia, Microsoft, and Alphabet. However, the revenue competition between Amazon and Walmart around the $700 billion mark serves as a real-time barometer of consumer indicators, suggesting volatility where the top two positions may alternate with each quarterly earnings report.