Amid Market Volatility, AI Value Investment Report Proves Resilience with 45% Returns


AI Value Portfolio Holds Firm as Financial Indices Plummet, Confirms 'Quality Recovery'… 45% Returns Robust Despite Currency and Rate Variables
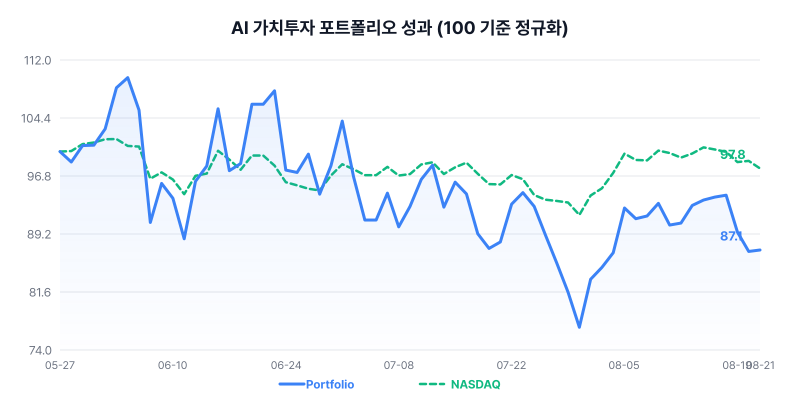
The domestic stock market faced a shocking downturn. The KOSPI index plummeted by over 3%, raising fears of a collapse below the 6,600 level, while anxiety is even gripping the U.S. market as the 10-year Treasury yield surged to 4.7%. Amidst such market volatility, the 'AI Value Investment Portfolio' has maintained solid performance. With a return of 45.51% on initial capital, the portfolio has proven its defensive capabilities through the concentrated valuation appeal of the AI semiconductor sector and rigorous weight management, despite external shocks.
Diagnosing Asset Flows Amid Interest Rate and Currency Shocks
Asset flows over the past week were stark. Total assets, which stood at $15,700 on the 17th, peaked on the 18th, but have since retreated to $14,550 as of the 21st due to concerns over the Federal Reserve's hawkish stance and a brief correction in the semiconductor sector. The contraction was particularly notable on the 19th and 20th; this appears to be a temporary trace resulting from aggressive profit-taking and weight rebalancing on stocks that reached their targets, rather than simple risk aversion. With the market's volatility index (VIX) exceeding 15% and uncertainty rising, maintaining a cash balance of '0' and sticking to high equity exposure is expected to work in favor of expanding returns when the market rebounds.
Quality of Holdings Viewed Through Valuation
Many stocks within the portfolio continue to hold strong appeal. Notably, the relative valuation of top-tier industry players stands out. Despite AMD's recent surge, its PER stands at a high 119.2x, yet its PEG ratio is 1.0, indicating that its growth potential is fully justified or corresponds to its current valuation. Leaders like Nvidia and Broadcom (AVGO) have PERs of 33.2x and 60.6x, respectively, but with PEGs in the 0.6 and 0.4 ranges, they can still be interpreted as undervalued relative to future growth. Conversely, Micron (MU) and Amazon (AMZN) show a balance between stability and growth, with PERs stable at 20-21x and PEGs at 0.14 and 1.42, respectively (Micron shows significant potential due to a very low PEG, while Amazon shows a somewhat high valuation relative to growth). Specifically, Micron’s EPS of $45.93 suggests that actual earning power will drive dividends and share price gains.
The Logic Behind Recent Rebalancing
The most recent trading logs reveal a tightrope walk between 'theme concentration' and 'risk hedging.' The decision to buy more Nvidia on the 21st reflected buyback demand and the sustained demand for AI chips. Conversely, the partial sale of Meta (META) and SOXL alongside the purchase aimed for sector rotation and volatility management—Meta due to intensifying competition in the ad market, and SOXL to control risks inherent to its 3x leverage. The massive purchase of Intel (INTC) and sale of SOXL on the 14th is also noteworthy. At the time, Intel's forward PER was 51x, but its PEG was low at 1.36, signaling an aggressive portfolio realignment aimed at technical recovery and valuation upside. The late-July strategy of reducing TQQQ to fill with SOXL, which led to the Intel purchase, reveals a calculated move targeting the 'semiconductor valuation spread' rather than simply chasing the Nasdaq.
Measured Market Outlook
For the time being, global markets are expected to see continued volatility due to high interest rates, high exchange rates, and sector-specific divergences. However, the earnings (EPS) and PEG ratios of the portfolio's core holdings will serve as a buffer against price declines. The current downward trend in the Won/Dollar exchange rate is positive for Korean investors in U.S. stocks. While yield volatility will be high due to the concentration in the AI semiconductor sector, given the high operating profit growth of these companies, the market downturn is likely to be utilized as a buying opportunity.
※ This report analyzes the simulation operation history of the AI Value Investment Portfolio and does not constitute investment advice. Actual investment should be undertaken at your own judgment and responsibility.
Current Holdings
| Ticker | Qty | Avg Cost | Current Price | PER | EPS |
|---|---|---|---|---|---|
| AVGO (Broadcom) | 5.67 | $326.03 | $364.03 | 60.6 | $6.01 |
| AMD | 7.17 | $198.62 | $469.46 | 119.2 | $3.94 |
| AMZN (Amazon) | 1.95 | $208.39 | $260.11 | 20.9 | $12.43 |
| TQQQ | 1.19 | $76.34 | $70.48 | 32.1 | - |
| INTC (Intel) | 2.80 | $104.56 | $92.13 | - | -$2.09 |
| SOXL | 16.23 | $71.22 | $122.21 | 43.1 | - |
| MU (Micron) | 0.23 | $996.00 | $974.33 | 21.2 | $45.99 |
| META (Meta) | 0.55 | $653.56 | $545.83 | 20.6 | $26.53 |
| NVDA (Nvidia) | 26.59 | $184.21 | $216.85 | 33.2 | $6.53 |
Recent Transaction History
| Date | Type | Symbol | Qty | Price |
|---|---|---|---|---|
| 2026-08-21 | Buy | NVDA (Nvidia) | 0.84 | $216.85 |
| 2026-08-21 | Sell | META (Meta) | 0.10 | $545.83 |
| 2026-08-21 | Sell | MU (Micron) | 0.03 | $974.33 |
| 2026-08-21 | Sell | SOXL | 0.85 | $122.21 |
| 2026-08-14 | Buy | INTC (Intel) | 2.80 | $104.56 |
| 2026-08-14 | Sell | SOXL | 0.90 | $145.36 |
| 2026-08-07 | Sell | SOXL | 0.95 | $132.33 |
| 2026-08-07 | Sell | TQQQ | 0.51 | $72.03 |
| 2026-07-31 | Buy | SOXL | 1.57 | $114.72 |
| 2026-07-31 | Sell | TQQQ | 0.30 | $63.30 |
Want detailed portfolio breakdowns?
Subscribe to the newsletter below to receive detailed daily investment reports.