AI Investment Report Achieves 54% Return


AI Portfolio Analysis Report: 54% Return Achieved, Semiconductor Focus Strategy Proves Effective
[Investment Analysis Specialist Reporter] May 25, 2026, 05:41 (KST)
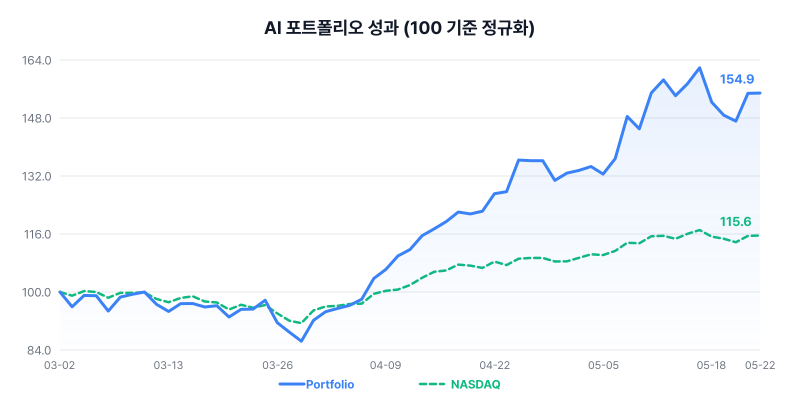
The AI portfolio 'PER/PEG Value Portfolio' has recorded robust performance, achieving a high return of 54.88% from an initial capital of $10,000 to a current total asset value of $15,488.039. Today's market showed mixed trends, with the KOSDAQ leading the charge by surging 4.99%. Major domestic and international stock markets, along with tech-heavy indices, closed with slight gains. The Won/Dollar exchange rate surpassed the 1500 mark, acting as a point of concern.
Portfolio Performance and Asset Trend
This AI portfolio has maintained stable growth over the past five days, managing asset volatility. Assets, which started at $15,235.315 on May 18th, experienced a slight correction to $14,712.991 on May 20th. However, it rebounded thereafter, reaching $15,488.039 on May 22nd, continuing its positive trajectory. Under a strategy that allocates 0% to cash and concentrates all assets into investments, the cumulative return of 54.88% is evaluated as an excellent performance, surpassing the market average.
Held Stock Valuation Analysis
The current portfolio is concentrated on key companies related to Artificial Intelligence (AI) and semiconductors. Let's examine the valuation attractiveness of each stock through its PER (Price-to-Earnings Ratio) and PEG (Price/Earnings to Growth Ratio) indicators. Nvidia (NVDA) shows a reasonable valuation relative to its growth at PER 33.7 and PEG 0.71. Broadcom (AVGO) remains attractive despite a high PER of 80.7, considering its growth potential (PEG 0.91). AMD (AMD) exhibits a high valuation with PER 149.4 and PEG 1.08, but it is expected to benefit from the growth of the AI market. Conversely, Meta Platforms (META) appears relatively undervalued with PER 22.1 and PEG 0.87, while Amazon (AMZN) shows a higher valuation for its growth potential with PER 31.7 and PEG 1.83. SOXL (Direxion Daily Semiconductor Bull 3X Shares ETF) as an ETF, records high PER (134.3) and PEG (0.80), displaying both high volatility and growth potential.
[Current Holdings]
| Symbol | Quantity (Shares) | Average Cost Basis ($) | Current Price ($) | PER | PEG | EPS ($) |
|---|---|---|---|---|---|---|
| Nvidia (NVDA) | 24.47 | 182.49 | 219.51 | 33.7 | 0.71 | 6.52 |
| SOXL | 19.01 | 61.36 | 178.39 | 134.3 | 0.80 | N/A |
| Broadcom (AVGO) | 5.67 | 326.03 | 414.57 | 80.7 | 0.91 | 5.14 |
| AMD (AMD) | 7.17 | 198.62 | 449.59 | 149.4 | 1.08 | 3.01 |
| Meta Platforms (META) | 0.98 | 653.56 | 607.38 | 22.1 | 0.87 | 27.51 |
| Amazon (AMZN) | 2.06 | 208.39 | 268.46 | 31.7 | 1.83 | 8.48 |
Recent Transactions and Strategy
Looking at the transaction history over the past month, the portfolio has steadily increased its position in Nvidia (NVDA), driven by confidence in surging AI chip demand and growth potential. Nvidia was consistently bought on April 10th, 17th, and 27th, establishing it as a core holding. This is part of an aggressive weighting strategy, considering its low PEG ratio and strong momentum. In contrast, partial profit-taking and portfolio rebalancing sales were conducted on SOXL whenever it experienced short-term spikes. This is interpreted as a strategy to realize gains and manage risk by capitalizing on its high volatility. On April 13th, Broadcom (AVGO) was additionally purchased, betting on the positive outlook for the semiconductor sector. On April 9th, a portion of Meta Platforms (META) was sold to adjust its weighting within the portfolio.
[Recent Transactions]
| Date | Type | Symbol | Quantity (Shares) | Price ($) | Reason |
|---|---|---|---|---|---|
| 2026-04-27 | Buy | Nvidia (NVDA) | 0.59 | 216.61 | Aggressively increasing position considering surging AI chip demand, sustained growth potential, and low PEG ratio. |
| 2026-04-24 | Sell | SOXL | 1.00 | 128.32 | Maintaining portfolio balance due to recent short-term surge. |
| 2026-04-17 | Buy | Nvidia (NVDA) | 0.93 | 201.68 | Strong growth potential due to surging AI chip demand and low PEG ratio. |
| 2026-04-16 | Sell | SOXL | 1.05 | 88.37 | Portfolio balance adjustment following recent short-term surge. |
| 2026-04-15 | Sell | SOXL | 1.11 | 85.96 | Partial profit-taking and portfolio balance maintenance due to short-term surge. |
| 2026-04-13 | Sell | SOXL | 1.17 | 80.56 | Partial profit-taking and portfolio balance maintenance as target price is approached. |
| 2026-04-13 | Buy | Broadcom (AVGO) | 0.49 | 379.75 | Expectation of further upside amid strong fundamentals and positive semiconductor sector outlook. |
| 2026-04-10 | Buy | Nvidia (NVDA) | 0.69 | 188.63 | Decision to buy more, considering surging AI chip demand, solid momentum, and attractive PEG valuation. Target price expected within the next 3 months. |
| 2026-04-10 | Sell | SOXL | 1.23 | 76.39 | Partial profit-taking and portfolio balance adjustment due to short-term surge. Aggressive investment stance leveraging high volatility is maintained. |
| 2026-04-09 | Sell | Meta Platforms (META) | 0.05 | 628.39 | Partial profit-taking and portfolio balance adjustment following recent rally. |
Market Outlook
The current market is driven by the advancement of AI technology and the subsequent increase in semiconductor demand, which is propelling the stock market overall. Major US indices like the S&P 500, Nasdaq, and Dow Jones are continuing their upward trend with slight gains, and the Philadelphia Semiconductor Index's 1.99% rise has positively impacted tech stock investor sentiment. The KOSDAQ's 4.99% surge reflects high investor interest and expectations for domestic tech and growth stocks. However, the Won/Dollar exchange rate surpassing 1500 and the decline in Brent crude oil (-3.22%) could act as potential destabilizing factors. The stability of the Volatility Index (VIX) and the decline in US 10-year Treasury yields suggest that market risk appetite has not significantly weakened. Overall, while an optimistic outlook centered on AI-related stocks is maintained, it is crucial to closely monitor macroeconomic indicators and exchange rate trends while preserving portfolio balance.
Curious about detailed portfolio information?
Receive detailed daily investment reports by subscribing to our newsletter below.
※ This report is an analysis of a simulated portfolio by AI and does not constitute investment advice. Actual investments should be made at your own judgment and responsibility.