Investment Report: 'AI Value Investing Portfolio' Achieves 49% Return Amid Market Meltdown


Implications of the 'AI Value Investing Portfolio's 49% Return in a Market Defined by Shifting Fear and Greed
On the morning of July 19, 2026, investors stared at two indicators on their tables, unable to hide their dismay. As the won-dollar exchange rate surpassed 1,487 won, marking a 10-month high, the KOSPI crumbled through the 6,800-point mark. Amid foreign capital outflows and concerns over exchange rate losses casting the shadow of the 'King Dollar,' the KOSPI 200 recorded a steep drop of nearly 7%. The U.S. market is also fluctuating wildly. The VIX index surged to 18.77, jumping over 12%, signaling a storm of volatility. Despite this climate of crisis, the 'AI Value Investing Portfolio' is recording a return of approximately 49.07% against its initial principal. While the market is in disarray, the journey of this portfolio—combining fundamentals with growth—remains a valid testament to resilience.
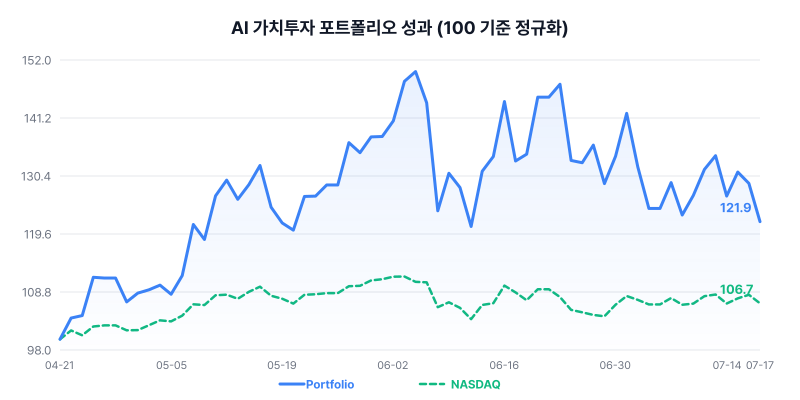
A Steep Asset Curve and the High-Alpha Narrative
Asset trends over the past week resembled a roller coaster. After peaking at $16,408 on the 13th, asset values fluctuated before undergoing a correction to $14,907 on the 17th. As the S&P 500 and Nasdaq indices oscillate within a range, the portfolio's volatility appears relatively high. This is due to the persistent presence of leveraged ETFs (TQQQ, SOXL). However, by not simply chasing rallies and by realizing partial profits to build a defensive line since early July, the portfolio has withstood the market shocks of the 15th and 16th, maintaining a stable return in the 40% range. The 'AI Value Investing Portfolio' is enduring this downturn not through simple momentum following, but through a balance of rigorous valuation screening using PEG indicators and aggressive growth pursuit.
Valuation Quality: The Intersection of Performance and Growth
The core holdings comprising the current portfolio possess overwhelming performance and growth potential that silence concerns over overvaluation. For NVIDIA and AMD, which account for the largest weighting, while PERs are high at 31.8 and 166.4 respectively, PEG indicators stand at 0.65 and 1.27, suggesting that current price levels are not yet overheated relative to their growth. Micron specifically shows a miraculous figure of PER 19.3 and PEG 0.13; with an EPS of $44.28 against a stock price of $853, it exerts defensive appeal even in a technical downturn. Broadcom (AVGO), Amazon (AMZN), and Meta (META) also feature low PEGs relative to their PERs (0.44, 1.43, and 0.96 respectively), demonstrating the substance to dispel superficial worries about 'high price, high PER.' However, 3x leveraged ETFs like SOXL, showing a PER of 24.2 and PEG of 0.81, require careful monitoring due to high intrinsic volatility.
| Ticker | Qty | Avg Price | Current Price | PER | PEG |
|---|---|---|---|---|---|
| AVGO (Broadcom) | 5.67 | $326.03 | $374.45 | 62.1 | 0.44 |
| AMD | 7.17 | $198.62 | $500.94 | 166.4 | 1.27 |
| MU (Micron) | 0.25 | $996.00 | $853.20 | 19.3 | 0.13 |
| NVDA (NVIDIA) | 25.76 | $183.15 | $207.40 | 31.8 | 0.65 |
| AMZN (Amazon) | 1.95 | $208.39 | $249.89 | 29.9 | 1.43 |
| SOXL (Semiconductor 3x) | 16.30 | $61.36 | $142.48 | 24.2 | 0.81 |
| TQQQ (Nasdaq 3x) | 2.86 | $76.34 | $70.74 | 36.3 | 1.33 |
| META (Meta) | 0.89 | $653.56 | $664.54 | 24.2 | 0.96 |
Strategic Trading Review: The Art of Profit Taking
The trading flow since late last month demonstrates a harmonious blend of 'aggressive buying' and 'prudent profit taking.' The additional purchases of Micron (MU) and NVIDIA (NVDA) in early and mid-June were based on valuation metrics like the PEG ratio, intending to aggressively capture the growth momentum of expanding AI chip demand. Conversely, for SOXL, partial sales were executed in two instances in mid-June and early July. The aim was to adjust valuation burdens caused by short-term surges and reduce the overall portfolio volatility.
In particular, the transactions on July 10 and 17 exemplify this strategy. To capture the uptrend based on the Nasdaq index, TQQQ was heavily bought to maintain bullish exposure, while simultaneously selling portions of SOXL and META to secure cash reserves. The META sale on the 17th was based on specific risk management logic citing 'expanded daily volatility and concerns over intensifying ad retention competition,' revealing it to be a preemptive measure for portfolio health rather than a simple stop-loss.
| Date | Type | Ticker | Qty | Price | Reason |
|---|---|---|---|---|---|
| 2026-07-17 | Sell | META (Meta) | 0.047 | $664.54 | Risk adjustment due to expanded volatility and intensifying competition |
| 2026-07-10 | Buy | TQQQ (Nasdaq 3x) | 2.865 | $76.34 | Continued strength in tech mega-caps, capturing further upside |
| 2026-07-10 | Sell | SOXL (Semiconductor 3x) | 0.858 | $192.45 | Profit taking and volatility control after short-term surge |
| 2026-07-03 | Sell | AMZN (Amazon) | 0.103 | $242.67 | Portfolio balance adjustment and partial profit taking |
| 2026-06-26 | Buy | NVDA (NVIDIA) | 1.289 | $195.74 | Attractiveness due to surge in AI chip demand and low PEG |
Market Outlook: Finding Opportunity in Chaos
We must face the current market situation squarely. The concurrent rise in WTI crude oil and gold futures, alongside the surge in the VIX index, implies a re-emergence of macro risks beyond a simple technical correction. With the weak won and global inflation concerns hampering the KOSPI and KOSDAQ, a valuation reassessment of U.S. tech stocks is also underway. However, as the 'AI Value Investing Portfolio' demonstrates, stocks backed by tangible EPS growth remain unshaken by exchange rate shocks and cooling theme sentiment. The fact that current prices for TQQQ and SOXL have adjusted back near their buy points may offer an opportunity for 'dip buying' rather than 'fear of highs' for panicked investors. Nevertheless, risk management must precede leveraged positions. For the time being, the U.S. 10-year Treasury yield and exchange rate volatility will be key variables determining the portfolio's returns.
※ This report analyzes the simulated operation history of the AI Value Investing Portfolio and does not constitute investment advice. Actual investments should be made under your own judgment and responsibility.
Curious about the portfolio details?
Subscribe to the newsletter below to receive detailed daily investment reports.