July 19 Investment Report: AI Value Investment Portfolio +49.1%


Wave of Terror Crashes into KOSPI, Plunging Over 6%... Is the Shield of the 'AI Value Investment Portfolio' Still Valid?
On July 18, 2026, South Korean investors woke up to furrowed brows. The KOSPI index plummeted by a staggering 6.37% from the previous day, falling below the 6,800 mark. Financial data scattered after the market close was stained crimson, screaming 'panic.' The decline in the Nasdaq, led by the semiconductor sector, inevitably brought a 'KOSPI catastrophe' to the Korean market, while the KOSDAQ also fell over 4%, freezing investor sentiment. Despite this market shock, the 'AI Value Investment Portfolio,' focused on global tech giants and semiconductor value, is recording a stunning cumulative return of +49.07%. However, the fact that the asset curve has bent from the $16,400 level to $14,900 over the past five days shows that this portfolio is also walking a tightrope of systemic risk.
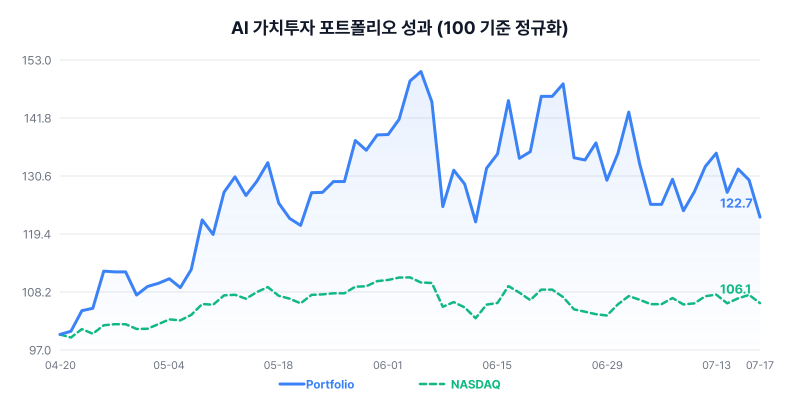
Death Throes of a Bear Market: The Fall of KOSPI and the Rise and Fall of US Tech Stocks
The core keyword of the market that day was 'inevitable correction.' The crashes of KOSPI and KOSDAQ went beyond a simple technical correction. With the Philadelphia Semiconductor Index (SOX) falling 1.63% and Nasdaq 100 futures cut by 1.55%, the outlook for the 'semiconductor cycle' has once again been put to the test. As the Won/Dollar exchange rate soared to 1,487 Won, heightening fears of a global liquidity crisis, the VIX index (Fear Index) surged to 18.77, reflecting investors' timid sentiment.
However, the indices of the US, the world's largest market, showed a contrasting flow to Korea. The Dow Jones and S&P 500 limited their declines to around 1%, and while gold futures rose revealing a defensive character, the surge in Brent crude oil prices and the decline in US 10-year Treasury yields are throwing complex signals about the economy. Amidst this turbulent market, this portfolio made a bold move by realizing some profits at the peak and minimizing cash allocation, but the total assets contracted partially due to the aftereffects of the crash.
Diagnosis of Holdings: The Intersection of Growth and Value
The powerful weapon this portfolio wields is selection through valuation metrics like 'PER and PEG.' Among current holdings, Micron (MU) maintains its allure as an 'attractively undervalued' company with miraculous figures of a PER of 19.3 and a PEG of 0.13. When the market falls, low valuation acts as a strong support line. Broadcom (AVGO) also suggests that its growth sufficiently defends the stock price, recording a PEG of 0.44 despite a high PER and an EPS of $6.03.
However, burdens exist in some stocks. AMD has reached a PER of 166.4, indicating that the stock is considerably overvalued relative to current performance, and a PEG of 1.27 also carries a hefty price tag considering its growth rate. Nvidia (NVDA) found a balance with a PER of 31.8 and a PEG of 0.65 amidst the absolute tailwind of AI chip demand, but recent volatility has turned it into a factor of fluctuation within the portfolio. Amazon (AMZN) and Meta (META) remain open to correction due to relatively high PEG ratios, alongside macro factors like intensifying competition in ads and platforms.
Review of Strategic Trading: The Fierce Battle Between Stop-Loss and Profit Taking
The recent operation flow of the portfolio was an intense movement to catch two rabbits: 'capturing momentum' and 'risk management.' The decision to partially sell Meta (META) on July 17 is interpreted as an intention to preemptively block risks following the deepening competition in the ad market. This was a clever defensive move taken before market concerns over slowing social media ad returns fully materialized.
Additionally, buying TQQQ (Nasdaq 100 Leverage) in early July to aggressively capture the strong momentum of semiconductor majors, while selling the surged SOXL (Semiconductor Leverage) to balance the portfolio, was a trading move that accurately read the market's axis. Increasing the weight by buying Micron (MU) and Nvidia (NVDA) at low points was a representative 'value investing' trade based on low PEG ratios, acting as the core engine driving returns until now.
Market Outlook: Finding Opportunity in the Cracks of Volatility
The current situation, with the Fear Index (VIX) soaring and the Won's value plunging, is not merely a stock price issue. It may be a 'Perfect Storm' phase where concerns over global liquidity tightening and a slowdown in the real economy intersect. However, what must be noted here is the rise in gold futures, a real asset, and Bitcoin showing strength while attempting a slight rebound. This suggests that even in a Risk-Off environment, market funds are displaying a 'hoarding' psychology toward certain high-risk assets.
The future success of this portfolio hinges on confirming a bottom in the semiconductor sector and the earnings sustainability of US Big Tech. The current return approaching 49% is a past glory, and the market is currently harsh. Moving forward, a 'Dry Ice' strategy is required to protect accumulated gains by raising Sell Levels and increasing cash allocation if volatility expands excessively. The market's bar has lowered, but it is the value investor's role to seize opportunities once again from that lower ground.
| Ticker | Qty | Buy Price | Cur Price | PER |
|---|---|---|---|---|
| AVGO (Broadcom) | 5.67 | $326.03 | $374.45 | 62.1 |
| AMD | 7.17 | $198.62 | $500.94 | 166.4 |
| MU (Micron) | 0.25 | $996.00 | $853.20 | 19.3 |
| NVDA (Nvidia) | 25.76 | $183.15 | $207.40 | 31.8 |
| AMZN (Amazon) | 1.95 | $208.39 | $249.89 | 29.9 |
| SOXL (Semiconductor Lev) | 16.30 | $61.36 | $142.48 | 24.2 |
| TQQQ (Nasdaq Lev) | 2.86 | $76.34 | $70.74 | 36.3 |
| META (Meta) | 0.89 | $653.56 | $664.54 | 24.2 |
| Date | Type | Symbol | Qty | Price |
|---|---|---|---|---|
| 2026-07-17 | Sell | META | 0.047 | $664.54 |
| 2026-07-10 | Buy | TQQQ | 2.865 | $76.34 |
| 2026-07-10 | Sell | SOXL | 0.858 | $192.45 |
| 2026-07-03 | Sell | AMZN | 0.103 | $242.67 |
| 2026-06-26 | Buy | NVDA | 1.288 | $195.74 |
| 2026-06-05 | Buy | MU | 0.251 | $996.00 |
※ This report analyzes the simulated operation history of the AI Value Investment Portfolio and is not investment advice. Actual investment should be done at your own judgment and responsibility.
Want to know more about the portfolio details?
Subscribe to the newsletter below to receive detailed investment reports every day.