Top 20% of Earners Made 8.7 Times More Than Bottom 20%

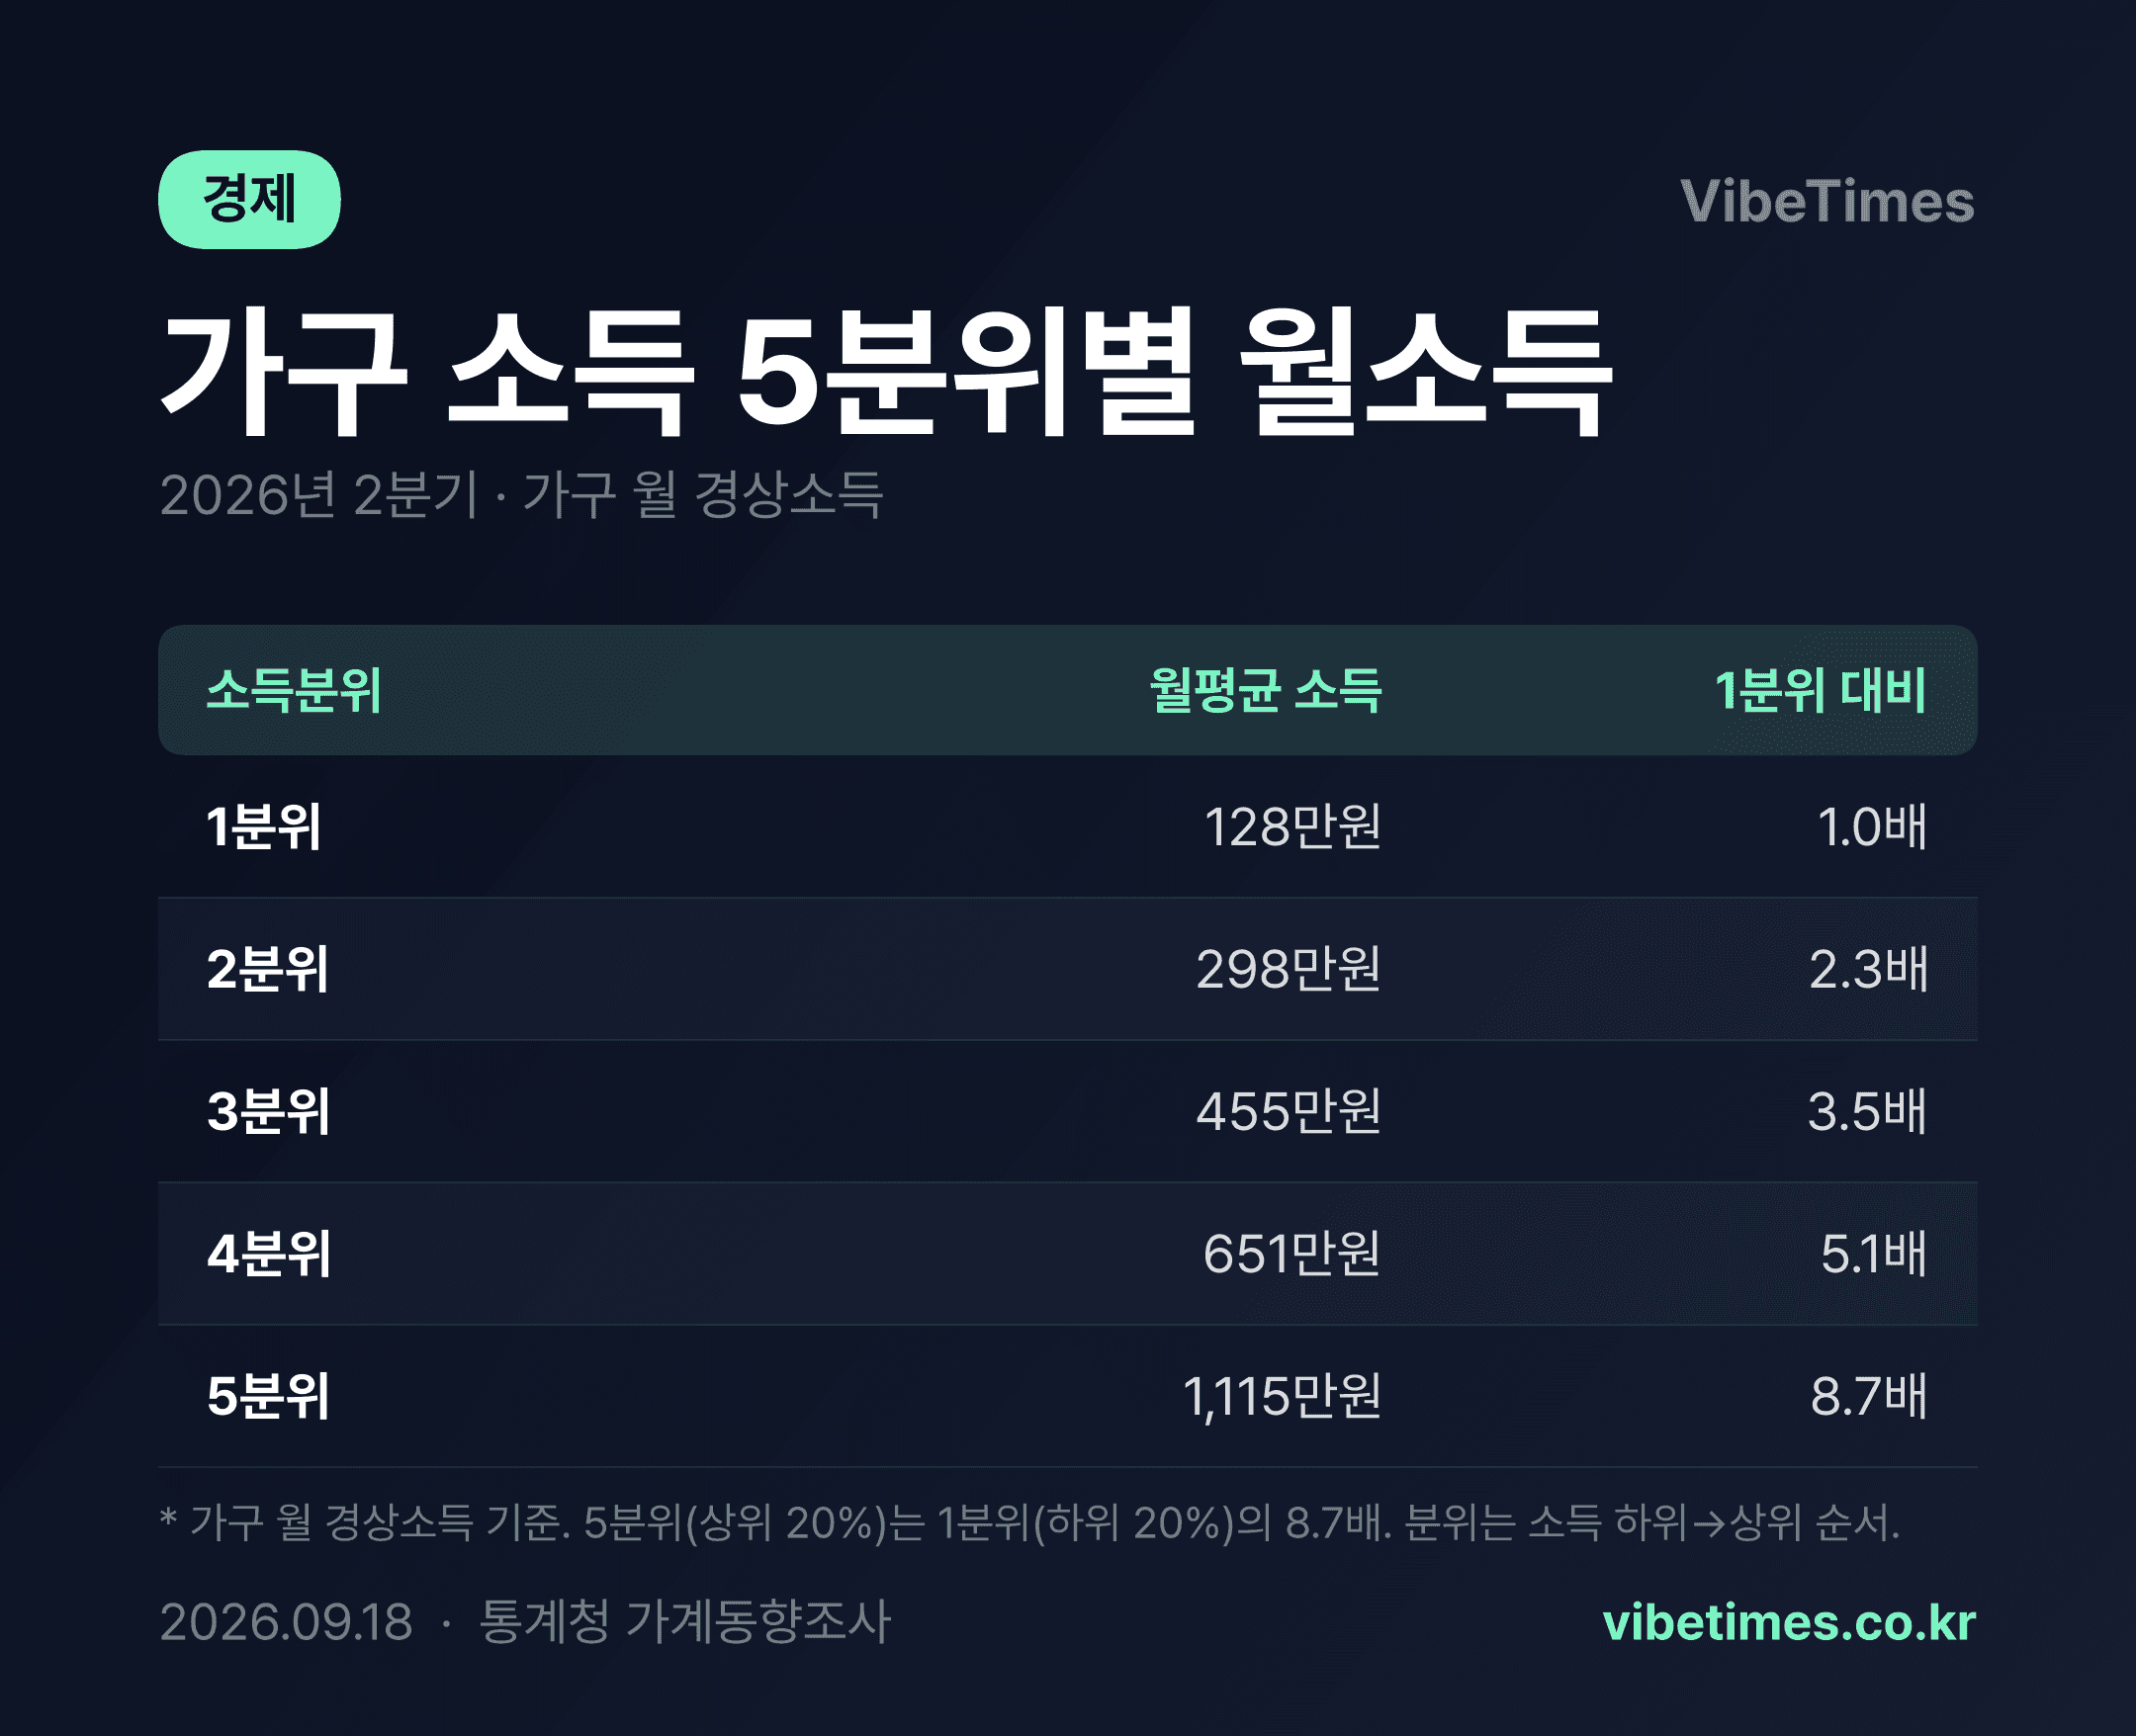
The Gap Between 11.15 Million Won and 1.28 Million Won a Month
Households in the top 20% of income earn roughly 9.86 million won more per month than those in the bottom 20%. Based on average monthly household gross income, the fifth quintile stands at 11.15 million won while the first quintile is at 1.28 million won, putting the gap between the two extremes at 8.7 times. This is how wide the income distribution structure is as confirmed by the statistics.
Climbing the income ladder quintile by quintile, one notices that the steps are not evenly spaced. The second quintile earns 2.97 million won and the third 4.55 million won, differing from the first quintile by about 1.69 million won and 2.58 million won, respectively. The fourth quintile, at 6.5 million won, is roughly 1.95 million won above the third, and the fifth quintile then jumps by more than 4.64 million won in a single step. It is a staircase that is gentle at the bottom and steepens toward the top—in other words, a structure in which the income distribution grows sharply at the upper end.
What the 8.7-Figure Gap Means
This 8.7-fold figure is a simple comparison of gross income at the household unit level—monthly averages combining labor income, business income, property income, and transfer income, before taxes. It should be noted that the government's officially announced 'equivalized disposable income quintile ratio' is calculated differently, after adjusting for household size and for taxes and transfer payments. Since the two are not the same concept of a ratio, they should not be directly compared or confused.
That said, the gross income gap itself is the starting point for discussions on distribution. The bottom 20% of households, with an average monthly income of 1.28 million won, have almost no margin once minimum living costs and affordable housing expenses are considered. By contrast, the top 20%'s 11.15 million won leaves room for savings and investment even after consumption, meaning the pace of asset accumulation between the two groups is bound to diverge even faster than the income gap itself. It is a structure in which differences that begin with income are amplified into wealth.
The Middle Tier's Position and Consumer Spending Power
The third quintile's 4.55 million won at the median shows that half of all households earn less than this amount. Falling short of the 5-million-won-a-month threshold often cited as the benchmark for the middle class, it suggests the center of gravity of the income distribution lies lower than commonly assumed. The fact that even the fourth quintile's 6.5 million won fails to reach half the fifth quintile's average further underscores how large top incomes are.
From a consumer market perspective, this distribution portends a polarization of demand. When the market splits between lower-tier households spending most of their income on near-subsistence consumption and upper-tier households with a low marginal propensity to consume, mid-priced products and services lose room to stand. For domestic companies, targeting consumers will grow increasingly difficult, and the bifurcation in which discount retail and premium retail strengthen simultaneously is likely to continue.
Points to Watch Going Forward
The key point to watch is which direction this 8.7-fold gap moves. If the share of low-wage jobs in the labor market shrinks, incomes in the first and second quintiles will improve first, potentially lowering the ratio. On the other hand, interest rate and asset price movements mainly affect fifth-quintile incomes and thus act as a factor widening the gap. The direction of the distribution structure will be determined by the balance between these two forces.
On the policy front, it should be premised that transfer income already accounts for a considerable share of bottom-tier households' gross income. Lowering the ratio without adjusting payment levels will be difficult, and effective results will require approaches that also expand the sources of labor income. How income trends by quintile move in the next survey is expected to serve as a benchmark for reading the broader currents of consumption, welfare, and industry.