Top 20% Earners Make 8.7 Times More Than Bottom 20%

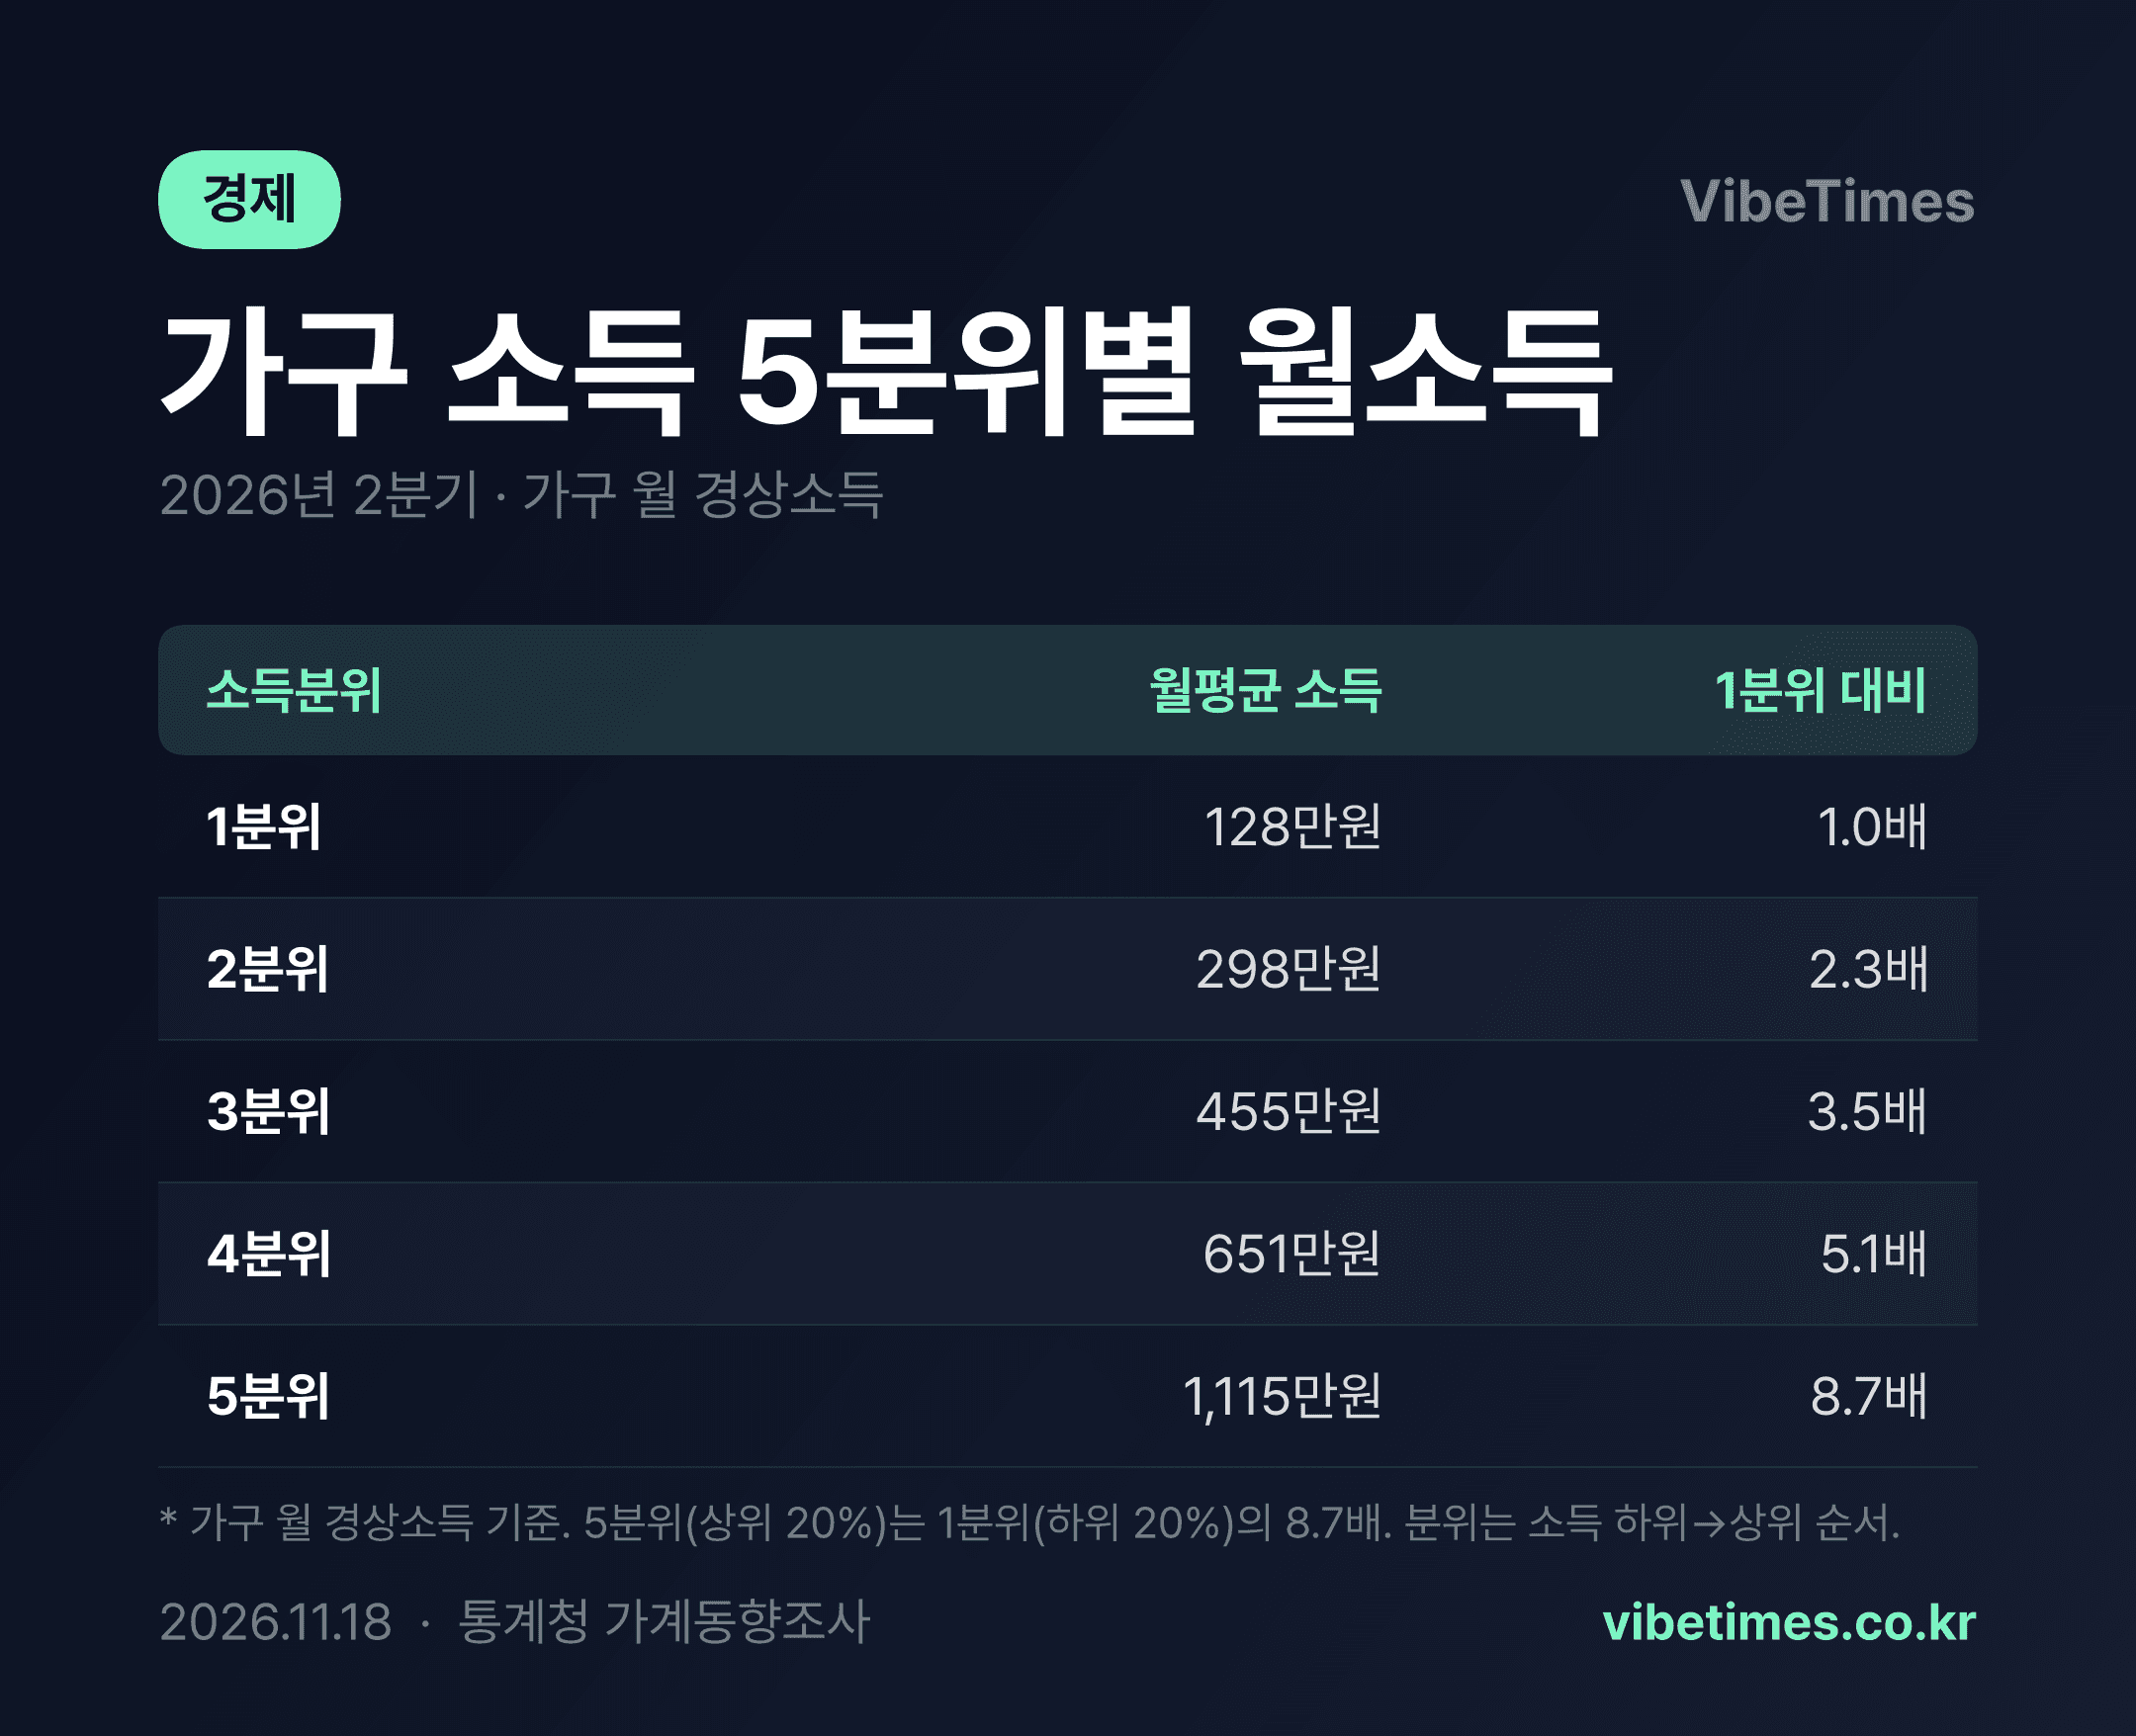
Households in the top 20% of income earn 8.7 times more per month than those in the bottom 20%. Dividing average monthly household income from Statistics Korea's Household Finance and Welfare Survey into five quintiles, the top quintile earns over 11.15 million won a month, while the bottom quintile stops at just 1.28 million won—a gap of roughly 9.86 million won between the two groups.
Imbalance Revealed in the Quintile Income Structure
Average monthly income for bottom-quintile households stands at 1,283,097 won. Second-quintile households earn 2,975,235 won—more than double the bottom group—while third-quintile households earn 4,554,497 won and fourth-quintile households 6,509,233 won. Only the top quintile, at 11,150,363 won, crosses the 10-million-won mark.
The gap becomes even starker when looking at income increments between quintiles. Moving from the first to the second quintile raises income by about 1.69 million won, but jumping from the fourth to the fifth adds 4.64 million won. The higher up the ladder, the taller each step. Income for the third quintile, the median group, falls short of the overall average, showing that the income distribution is pulled upward by a small number of households at the top.
What the 8.7-Figure Ratio Means
Regular income refers to a household's total income, combining earned income, business income, property income, and transfer income. Because the figures are raw amounts unadjusted for household size, differences in dual-earner status and household composition are reflected as they are. Top-quintile households tend to have more dual earners and higher-paid workers, which widens the household-level gap.
That said, the 8.7-fold ratio is calculated differently from the government's official 'equivalized disposable income quintile ratio,' which adjusts for household size as well as taxes and social insurance contributions and typically comes out at around 5 to 6. The figure in this comparison uses unadjusted household income, revealing the fundamental gap in income earned through the market.
A Chain Reaction into Wealth and Consumption Gaps
A monthly income gap of 9.86 million won translates directly into a difference in how much households can save and invest. Top-quintile households can channel surplus funds into assets after essential spending, while bottom-quintile households must devote most of their income to living expenses. This creates a cycle in which income gaps become wealth gaps, which in turn widen gaps in interest and dividend income.
The impact on consumption is also significant. Lower-quintile households are more vulnerable to inflation. With a high share of hard-to-cut spending such as food and housing, their real burden is comparatively heavier. Higher-quintile households, with a lower share of essential spending, have far more room to absorb price fluctuations.
Policy Implications and Outlook
This income structure demands attention not only to earned income but also to the role of transfer income. Given that transfers account for a high share of bottom-quintile households' income, the effectiveness of public transfers such as pensions and benefits can be seen as a key variable in stabilizing lower-income households' earnings.
As population aging deepens, the share of elderly households within the bottom quintile is likely to grow. To keep household income gaps from widening further, retirement income security and employment policies for older adults will need to work in tandem. In a period of sustained asset price increases, the structure in which income gaps amplify wealth gaps also warrants scrutiny. With the raw market income gap laid bare in the 8.7-fold figure, it is expected to serve as a baseline indicator for gauging the direction of redistribution policy.