Investment Report: Up to 17% Returns Driven by Undervaluation Repricing


[Daily Market Insight] KOSPI Surpasses 6600, A Repricing Rally Driven by Fundamentals Rather Than Foreign Investment
The Seoul market is riding a historic bullish wave. As of August 2, 2026, the KOSPI has soared by over 1,000 points, recording an unprecedented high of 6,595.45. Behind this explosive rebound (+17.91% compared to the previous day), which cannot be explained solely by foreign investor sentiment, lies an active market repricing of stocks undervalued relative to their earnings. Amidst this global rally in overlooked stocks and the preference for high-growth technology stocks, the 'AI Value Investment Portfolio' has also delivered remarkable performance, accurately capturing the market's pulse.
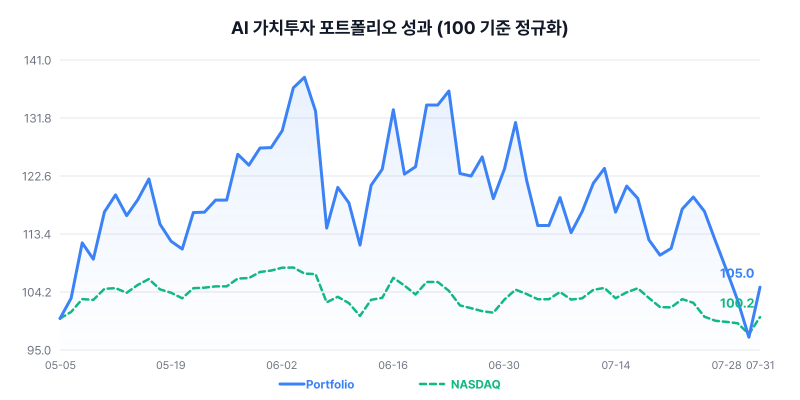
Mapping the Portfolio and the Market's Trajectory
This portfolio saw its returns rise sharply during the rapid valuation reassessment centered around semiconductor and tech stocks that began in late July. The asset size, which stood at approximately $13,600 at the end of July, surged to $13,911.005 in just a few days, briefly eyeing $14,800 and刷新ing an all-time high. The recent sharp decline in the won's value (KRW/USD +1.13%) added a multiplier effect to the value of the dollar-based assets, resulting in a staggering return of +39.11% against initial capital. However, it is worth noting that the asset graph underwent a temporary adjustment during the settlement of some assets that were liquidated on July 31.
The Aesthetics of Undervaluation and the Potential for Growth
Currently, the core holdings of this portfolio are capturing both technical momentum and valuation safety. True to the name 'AI Value Investment Portfolio,' the results are particularly striking as the PEG ratio—which measures undervaluation potential based on high growth expectations—has been actively utilized.
Micron (MU) shows a competitive PEG ratio of 0.11 with a PER of 16.7, delivering the welcome news that both earnings (EPS $52.39) and stock price are rising together as it emerges from the semiconductor slump market had feared. Broadcom (AVGO), despite the burden of a 64.5 PER, has a PEG indicator of 0.42, suggesting that the current stock price is still cheap relative to its growth potential. This implies a shift from simply being an 'expensive stock' to one where 'growth speed can cover the price increase.' Nvidia (NVDA) and Amazon (AMZN) are also maintaining a steady trend with PERs of 29.9 and 27.1, respectively.
Finding the Intersection of Sector Rotation
Examining the trading history over the past week reveals that this portfolio is not merely stubbornly 'all-in' but is making moves to maximize returns through meticulous valuation analysis. Particularly impressive was the decision to sell Meta (META), a major pillar of the portfolio, at the end of July.
Due to concerns over slowing ad revenue and delays in AI monetization, a massive shift of capital was executed toward the semiconductor sector, where growth has been proven. The strategy of clearing out TQQQ (Nasdaq 3x Leverage) and replacing the centerpiece with SOXL, based on the semiconductor index (SOXX) which was significantly undervalued relative to its fair PEG, is now paying off amid the semiconductor sector's surge. The decision to double down on the semiconductor explosion by purchasing additional SOXL on July 31 led to stock price gains.
| Ticker | Qty | Bought At ($) | Current Price ($) | PER |
|---|---|---|---|---|
| AVGO (Broadcom) | 5.67 | $326.03 | $387.84 | 64.5 |
| AMD (Adv. Micro Devices) | 7.17 | $198.62 | $485.39 | 161.3 |
| MU (Micron) | 0.25 | $996.00 | $874.66 | 16.7 |
| NVDA (Nvidia) | 25.76 | $183.15 | $195.04 | 29.9 |
| AMZN (Amazon) | 1.95 | $208.39 | $235.50 | 27.1 |
| META (Meta) | 0.64 | $653.56 | $539.03 | 20.3 |
| TQQQ (ProShares UltraPro QQQ) | 1.70 | $76.34 | $63.30 | 32.5 |
| SOXL (Direxion Daily Semi) | 18.93 | $71.22 | $114.72 | 19.5 |
| Date | Type | Ticker | Qty | Price ($) |
|---|---|---|---|---|
| 2026-07-31 | BUY | SOXL | 1.57 | $114.72 |
| 2026-07-31 | SELL | TQQQ | 0.30 | $63.30 |
| 2026-07-31 | SELL | META | 0.11 | $539.03 |
| 2026-07-31 | SELL | SOXL | 0.87 | $114.72 |
| 2026-07-24 | BUY | SOXL | 1.07 | $157.50 |
| 2026-07-24 | SELL | META | 0.13 | $606.10 |
Bubble or New Paradigm?
The market is currently showing an aggressive appetite for risk assets, with the VIX fear index dipping to 15.99. Despite interest rates rising to 4.745%, the continued rise in stock prices suggests that the market views earnings growth (EPS)—the 'numerator' of valuation—as more important than the 'denominator' of interest rates. In particular, the simultaneous surge of the KOSPI and KOSDAQ can aptly be described as a 'Valuation-up Shock'.
However, the fact that the PEG ratio of the semiconductor index remains below fair value suggests that this rally is likely a justified repricing driven by industry improvement and technological innovation, rather than a simple bubble. Nevertheless, the high proportion of leverage ETFs (such as SOXL) poses a risk in the event of increased volatility, necessitating close monitoring of the semiconductor economic cycle going forward.
※ This report is an analysis of the simulated operation history of the AI Value Investment Portfolio and does not constitute investment advice. Actual investments should be made at your own discretion and responsibility.
Want to know more about the portfolio details?
Subscribe to the newsletter below to receive detailed daily investment reports.