South Korea Tops 20% Elderly Population as Birth Rate Hovers Around 0.7

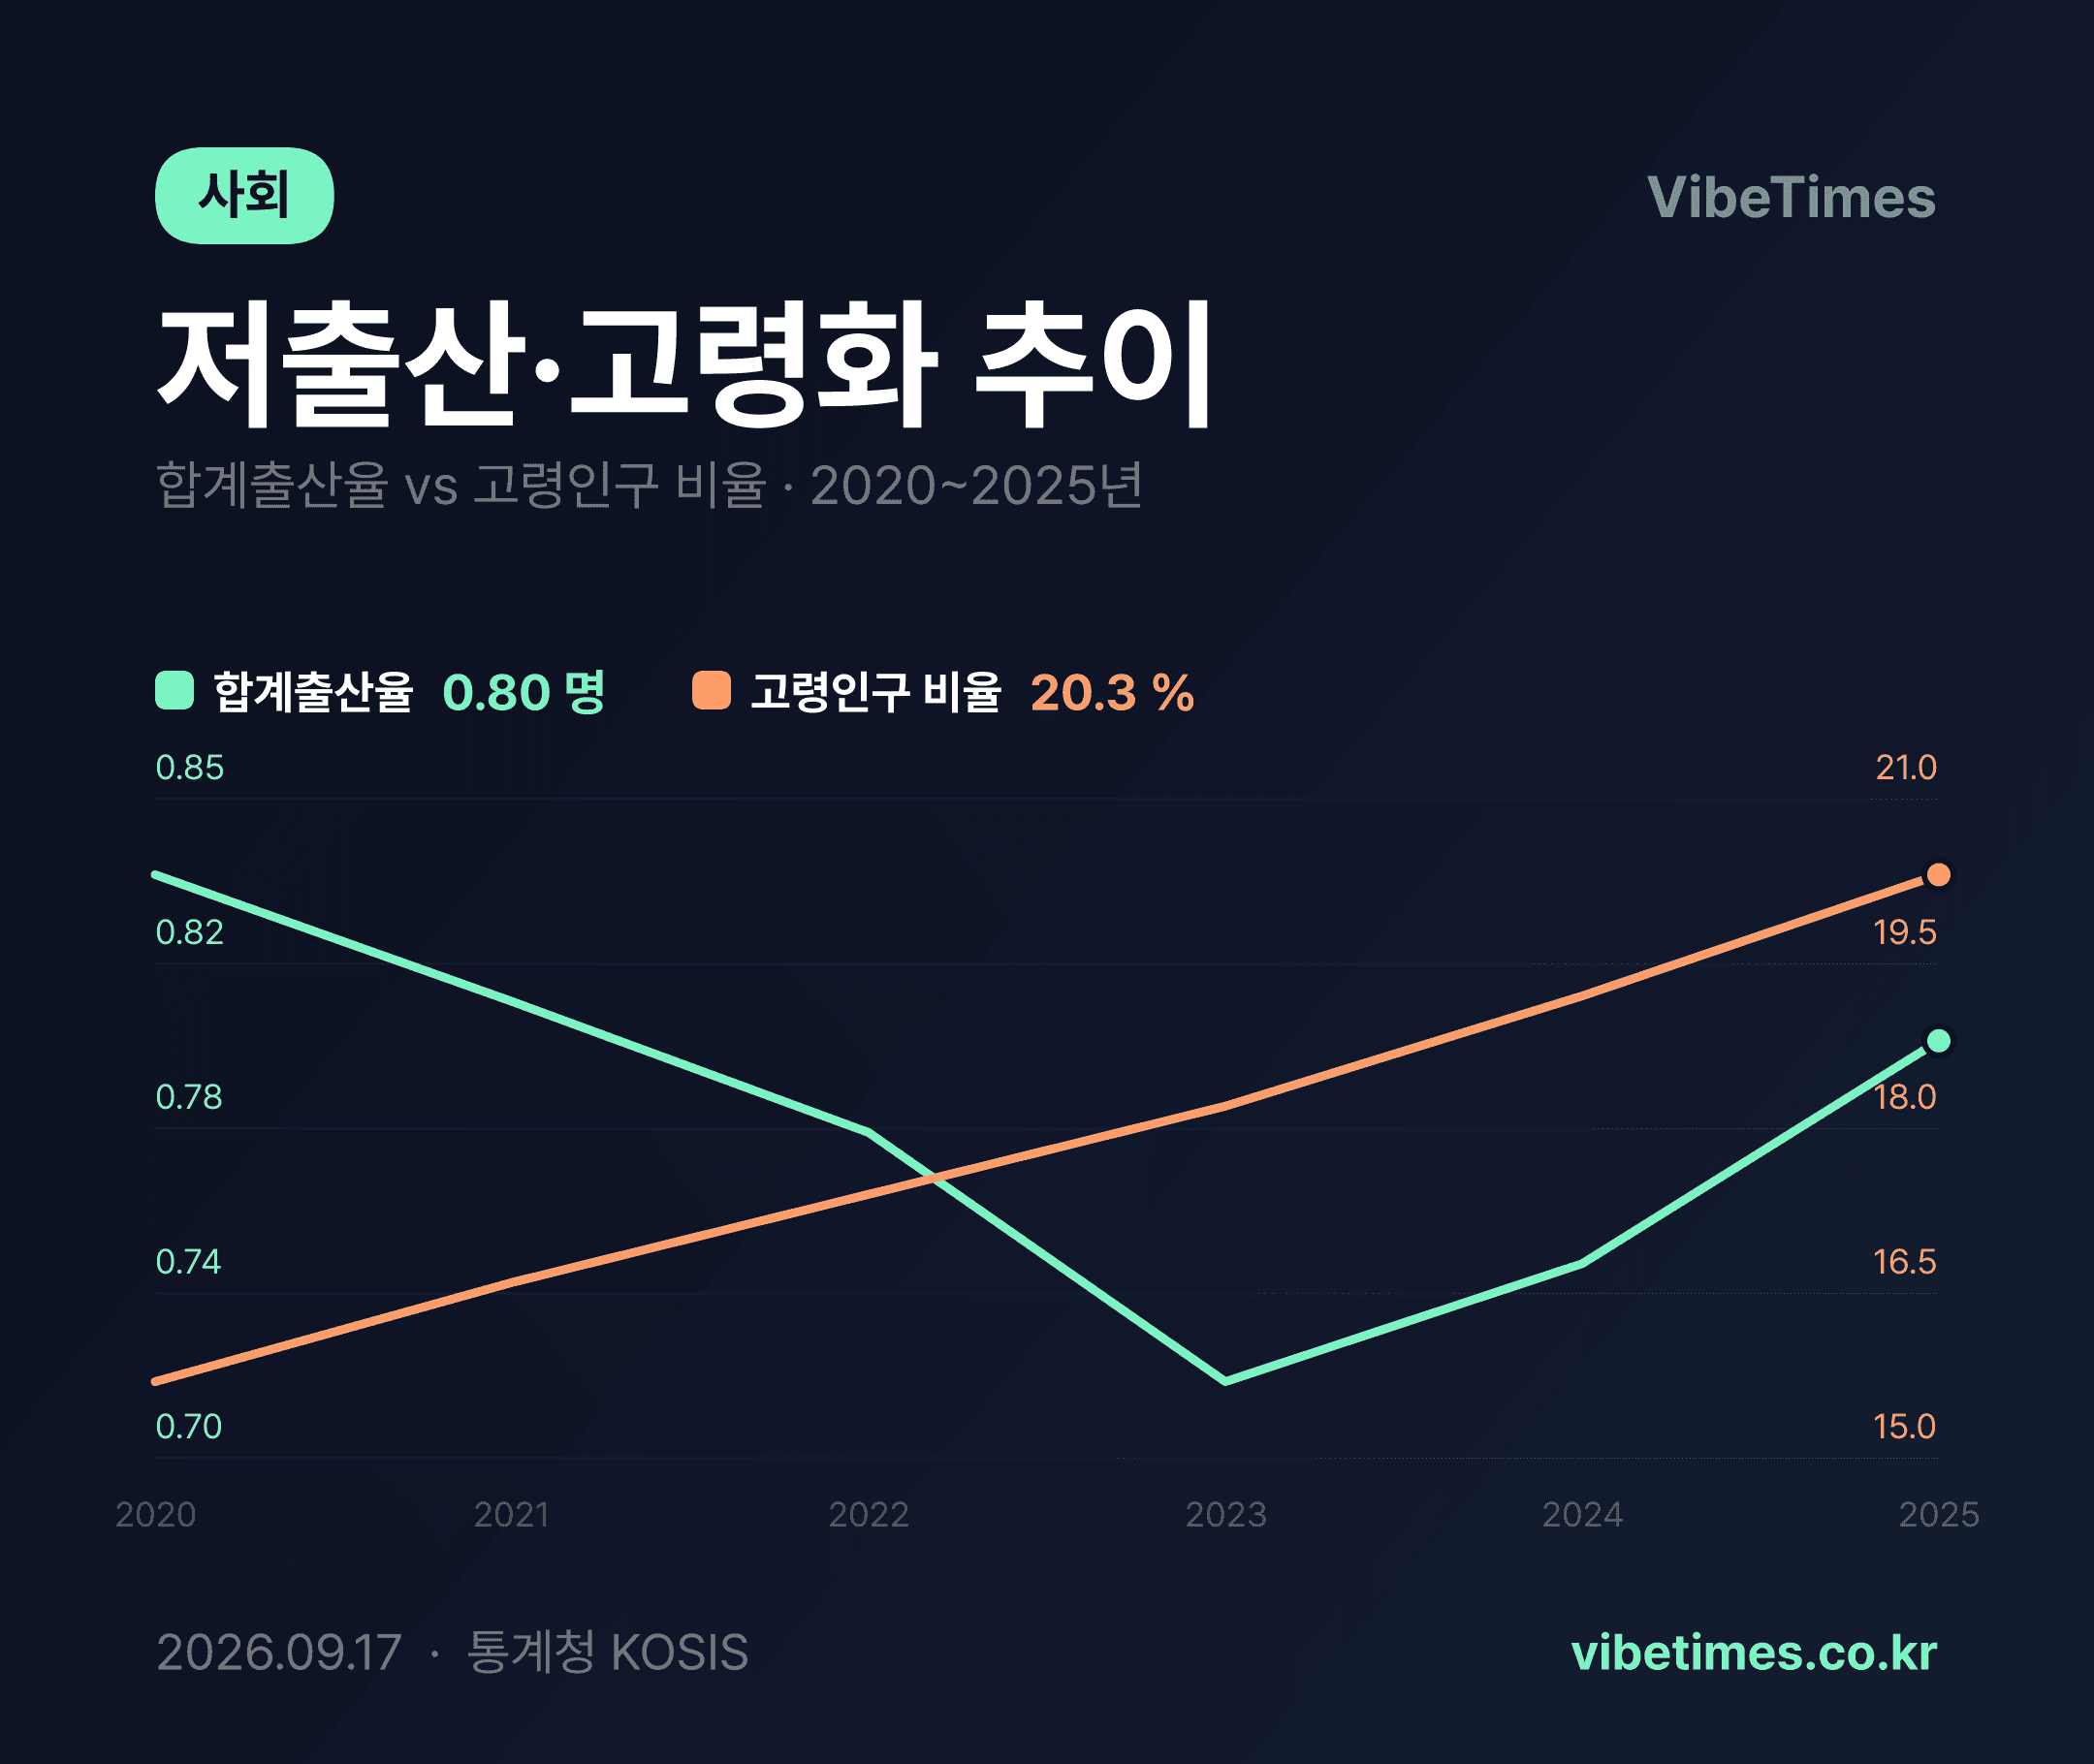
The share of elderly people in South Korean society has surpassed 20% for the first time.
Statistics as of September 2026 show that people aged 65 and older account for 20.3% of the total population of 51,117,378. The country has thus crossed the 20% mark, the official threshold for entering a "super-aged society." Meanwhile, the total fertility rate is showing signs of rebounding from the 0.7 range over the same period, putting South Korea at a turning point where the two trends of low fertility and aging are moving in opposite directions.
Rapid Aging Signals a Shifting Economic Structure
The elderly population ratio rose from 15.7% in 2020 to 20.3% in 2025, a 4.6 percentage-point increase in just five years, or an average of 0.9 percentage points per year. That is a compressed pace compared with the time it took Japan and other major advanced economies to cross similar thresholds. As the working-age population shrinks, demand for elderly consumption as well as medical and caregiving services is set to expand structurally. This drives the growing fiscal burden on pensions and health insurance, while also fueling growth in the silver industry, medical, and nursing care service markets—points that suggest the industrial map is poised to change.
The Meaning—and Limits—of the Fertility Rebound
The total fertility rate hit a low of 0.721 in 2023, then recovered for two consecutive years, reaching 0.748 in 2024 and 0.799 in 2025. This marks a reversal of the downward trend that had continued since 2020, when the rate stood at 0.837. The rebound is attributed to an increase in marriages and a demographic factor: the large cohort born in the 1990s entering prime marriage age.
Even so, a rate below 0.8 remains among the lowest in the world—just one-third of the replacement fertility rate of 2.1 needed to keep the population stable. While the elderly population share climbs by nearly 1 percentage point each year, the fertility rate is rising by only 0.03 to 0.05 births per year. The numbers make the limits clear: even if the rebound continues, it will be far from enough to reverse the pace of population aging.
What Income Gaps and Household Trends Suggest
The top quintile of households by income—the richest 20%—earned an average of 11,150,063 won per month in the second quarter of 2026. Given the gap with lower income brackets, upper-income households are the ones driving consumption and investment capacity. As the elderly population grows, consumption polarization between asset-income-heavy affluent households and retired households reliant on labor and transfer income is likely to become even more pronounced. For businesses, this calls for market strategies built around two pillars: senior consumption and premium spending by high earners.
Whether the fertility rebound will continue is the first thing to watch. If the rate climbs back above 0.8 after 0.799 in 2025, it could be read as the combined effect of low-fertility policies and demographic momentum. However, the elderly population ratio is expected to keep rising by roughly 1 percentage point per year over the coming years, surpassing 30% by the mid-2030s. Productivity gains to offset a shrinking labor force and a transition toward an aging-friendly industrial structure will be the key variables determining economic growth. The numbers are already pointing the way.