Top 20% of Earners Made 8.7 Times More Than Bottom 20%

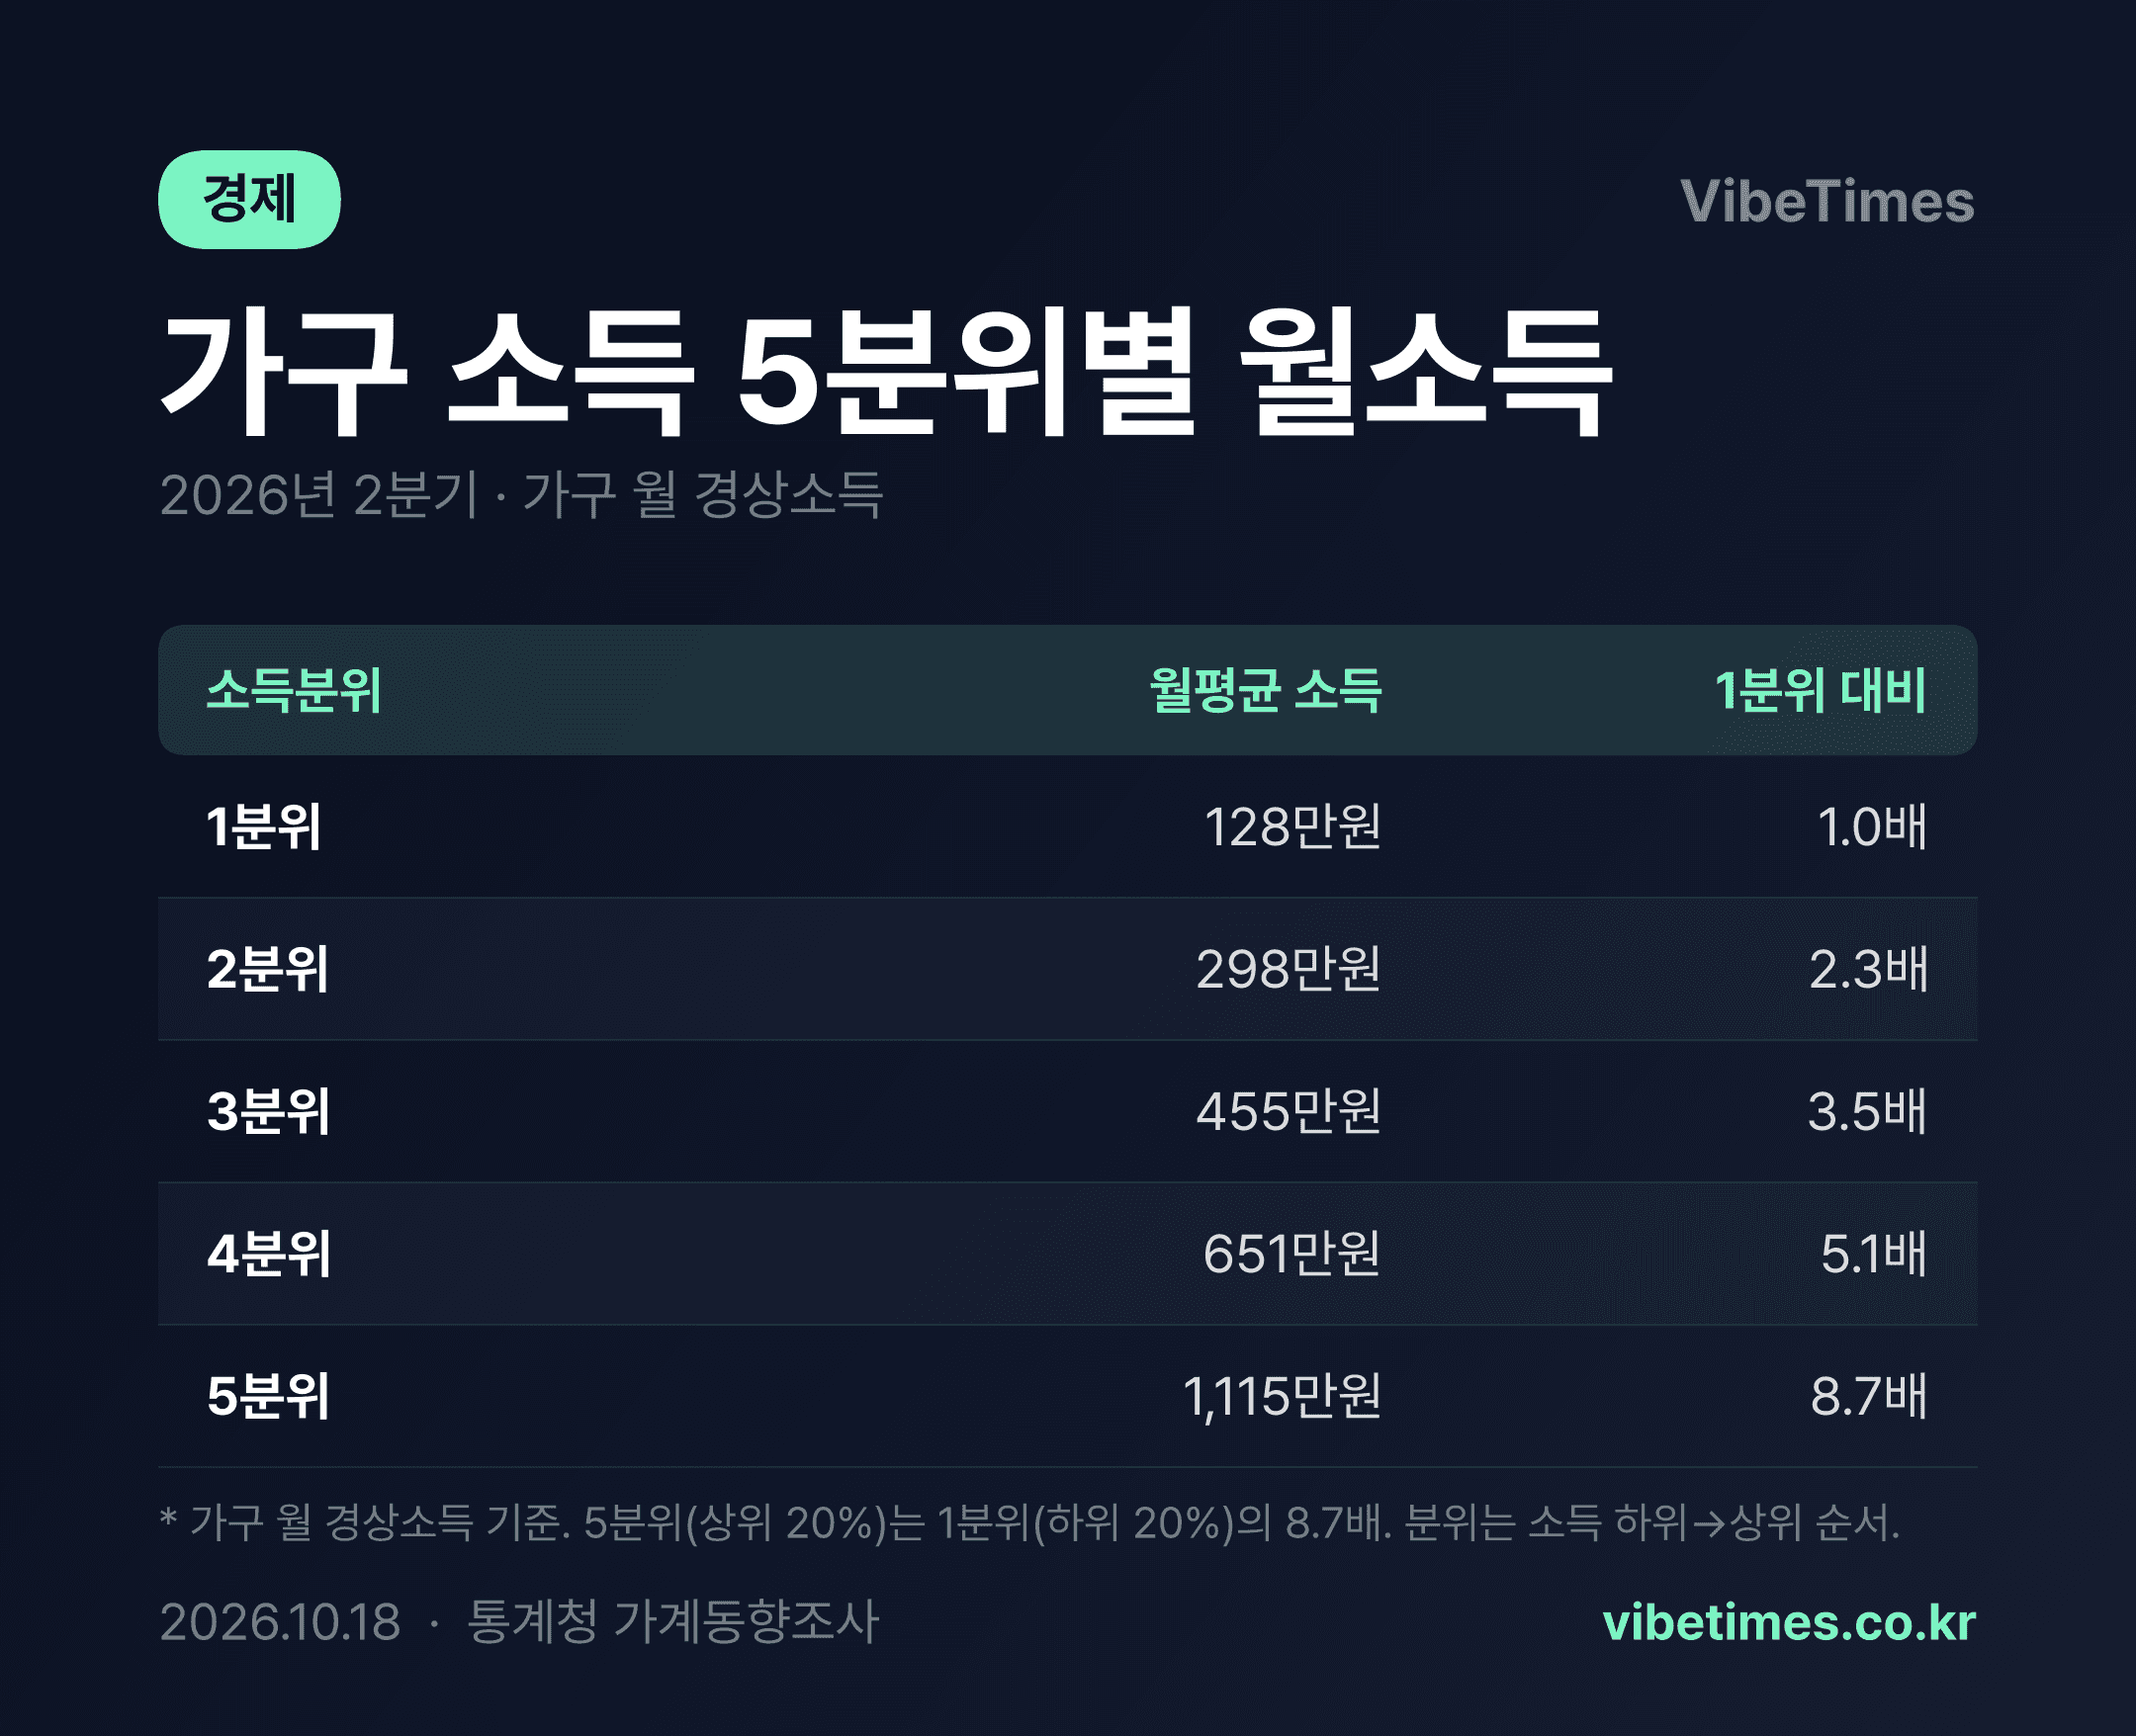
Households in the top 20% income bracket earned an average of about 9.87 million won more per month than those in the bottom 20%.
According to the average monthly household disposable income by quintile confirmed through statistics, the fifth quintile earned 11,150,363 won while the first quintile earned 1,283,097 won. A simple calculation puts the gap between the two groups at exactly 9,867,266 won. The key point is that the income distribution divided into five brackets forms a far steeper staircase than expected.
An Income Staircase That Widens With Each Quintile
Laying the disposable incomes of each quintile side by side reveals that the gaps are not uniform: 1,283,097 won for the first quintile, 2,975,235 won for the second, 4,554,497 won for the third, 6,509,233 won for the fourth, and 11,150,363 won for the fifth. Moving from the first to the second quintile, income rises by about 1.69 million won, but the jump from the fourth to the fifth quintile is about 4.64 million won all at once. The structure is such that the stairs get taller the higher you climb.
In percentage terms, the difference is even starker. Fifth-quintile income is 8.7 times that of the first quintile and 2.4 times that of the third. Given that the median third quintile approximates the overall average income level, the top 20% stands at a considerable distance even from most other households.
What the Gap Indicator Means—and Its Caveats
The disposable income referred to here is a pre-tax concept that combines earned income, business income, property income, and transfer income. It is calculated differently from equivalized disposable income, which adjusts for household size. The government's officially announced quintile ratio based on equivalized disposable income typically stands at 5 to 6 times, a result of accounting for household size as well as taxes and transfer payments. By contrast, the current figure represents the gross market income at the household level, so the 8.7-fold figure does not conflict with the government's official gap indicator—the two simply use different measurement windows.
Even so, the meaning of this figure is clear: it shows that income inequality between households is already formed on a very large scale at the stage before taxes and welfare transfers are factored in. It can serve as a baseline for judging how much redistribution mechanisms reduce this market-stage gap.
What the First-Quintile Income Structure Tells Us
What deserves attention is the absolute level of the first quintile. Disposable income of just over 1.28 million won per month is lower than the monthly wage of a single minimum-wage worker. This bracket likely includes a substantial number of households with unpaid household heads, elderly single-person households, and non-economically-active households. As society ages further, the share of retired households with no income filling the first quintile will grow, meaning this figure is likely to fall further or remain at elevated levels.
By contrast, the 11.15 million won of the fifth quintile is interpreted as the result of business and property income layered on top of earned income. Income from financial assets and real estate tends to be concentrated among the top earners, creating a structure in which rising asset prices further expand fifth-quintile income. This shows how a self-reinforcing cycle can operate, in which income gaps are amplified again through asset gaps.
Remaining Challenges for Policy and the Market
The key issue going forward is redistribution efficiency. If the market-stage gap stands at 8.7 times, how much taxes and transfer payments compress it will determine the success or failure of the welfare system. The fact that the ratio based on equivalized disposable income falls to 5 to 6 times is evidence that redistribution mechanisms do work, but it remains a burden that aging and wealth concentration—both of which widen the underlying gap itself—are proceeding at the same time.
Structural change is also expected in the consumer market. With monthly incomes in the first and second quintiles stuck at 1.3 to 3 million won while the fifth quintile exceeds 11 million won, a polarized consumption pattern—in which budget and premium consumption expand simultaneously—is expected to deepen. Discussions of household debt and retirement income can only take an effective direction when premised on the income distribution by quintile.